Georgists like to say that one of the many advantages of a real estate tax over other taxes is that, if the owner does not pay it, eventually s/he’ll lose the property, which can be sold to pay the arrears. But “eventually” is an important word here.
Now Cook County Treasurer Maria Pappas has compiled data showing the extent to which taxes don’t get paid. For this purpose, “not paid” means “not paid within a month of the due date.” I suspect that in most cases, these taxes are eventually paid, with a penalty (9% interest, recently reduced from 18%) included. But years might elapse, and various games can be payed by “investors” regarding these properties. (Some detail is on pages 23-26 of this pdf.)
The reports are broken out by property class, by ward, by municipal area, and by taxing agency, showing amount billed and amount paid, and can be downloaded to spreadsheets.
Countywide, 96% of all taxes billed were collected within a month of the deadline. In the impoverished Village of Ford Heights, only 28.55% of taxes got paid, but no other community had less than 50%. The six lowest percentages are all in the south suburbs, followed by the Chicago community areas of Englewood and West Garfield Park.
For parcels coded as “vacant,” only 71% of taxes were collected; all the other categories were above 95%. Total taxes billed to vacant parcels was $121,810,594, of which $86,873,652 was paid, implying that, were vacant parcels taxed at the same rate as commercial and industrial land, government revenue would increase by something like $130 million to $183 million — not counting the development which such a tax increase would encourage.
Mural Detail, St. Joseph Church, Hammond IN CC BY-NC-ND 2.0 by Noah Vaughn
According to this report from Indianapolis, an insurance company CEO has observed deaths of working-age people (covered by his company’s policies) running 40% above pre-‘demic levels, and says most of the claims aren’t covid deaths.
The CDC do publish some data on deaths by age, and for the age group 18-64 we see
year weeks “covid” deaths total deaths
2021-22 40-48 24,792 145,529
2020-21 40-48 12,493 143,491
2019-20 40-48 0 120,317
2018-19 40-48 0 119,029
So we have about a 20% increase, most of which is listed as “covid.” The remainder might reasonably be due to knock-on effects of the lockdowns and lockouts. The difference between 20% and 40% is curious, but his insured aren’t a random sample of the total population. He also notes an increase in disability claims.
Since the vaxxed population would have been higher in 2021 than 2020, this data would be consistent with some deaths being caused by the vax, as well as few deaths prevented by it.
We have a new report from Cook County Treasurer Maria Pappas, subtitled “2020 Cook County property tax analysis: A heavier burden for businesses, Black and Latino suburban property owners.” It’s got more detail than I recall seeing published before, including two decades of total real estate tax revenue countywide and by triad, and (for the past two years only) median taxes per parcel for residential and commercial, by municipality and township (and limited data for Chicago wards) as well as a fun list of the ten highest residential and commercial tax bills for each township. The extra load Cook County’s current classification system places on commercial property is noted.
All of this data for individual parcels has been available on the Treasurer’s web site for some time, but it wasn’t assembled for convenient use.
It’s likely impossible to discuss the real estate tax system (let alone the complete scope of public revenue) in a way which can hold the attention even of people who find themselves heavily burdened by the way government is funded and operated. And Pappas’ office got this information out quickly, as the taxes have only recently been calculated and won’t be due until October 1. All the same, there are problems which one hopes will be fixed next time this is done (and one certainly hopes there will be a next time, soon.)
Noting the continuing rise in revenues, the report asserts that “[t]he bigger tax burden is not being shared equally.” What could this mean? What would be equal? Should we fund government by a poll tax, which is the only way to get everyone to pay the same amount? Perhaps the writer means “equitably,” a desirable thing tho difficult to agree on. It’s then observed that “Property owners in many south suburbs continue to pay far more in taxes than landowners in other parts of the county.” I will set aside the fact that “property” and “land” aren’t the same thing, and assume that the writer may have meant “real estate taxes are higher in many south suburbs than in other parts of the county,” which is sufficiently cautious that it must be true.
But in fact the amount of real estate tax paid by a median homeowner is much lower, less than $4,000/year in Bloom and Thornton townships (page 49 of the statistics section of the report), less than any of the north suburban townships (page 56).
That doesn’t mean that the taxes in Bloom and Thornton aren’t a burden for many, because taxes imposed on struggling people are always a burden. And the very high tax rates reduce market values, while increasing the extra burden on renters (who cannot benefit from the “homeowner exemption.”)
The report makes no attempt to separate the value of land from the value of improvements, even tho the assessments provide this breakout for each parcel. There’s no distinction between owner-occupied and renter-occupied homes. The only mention of vacant land is to say that it’s been ignored, as has mixed-use (residential+commercial) property. There’s no mention at all of exempt government-owned land.
It would be helpful to include reference maps, especially of townships. And in an ideal world, the tables would be offered in spreadsheet format.
Thanks to Center Square via Wirepoints for alerting me to a (weekly?) mortality tally from the CDC. It provides weekly counts of death by underlying natural cause, for each state. For Illinois, unredacted Covid-19 deaths started with the week ending March 21, and the report covers the 22 weeks thru August 15. Counts for 2019 as well as 2020 are shown. My tally below attributes to Covid those deaths where it is an “underlying cause.”
Covid All other Total
Year 2019 N A 43,223 43,223
Year 2020 6,779 46,537 53,316
So if I am interpreting this correctly, we seem to have had 46,537-43,223=3314 excess deaths, not due to Covid, but possibly due to the plandemic lockdown measures. Given that most Covid victims had co-morbities, which might for some have proved fatal without Covid, this figure must be an understatement. Further, if some excess deaths are due to people not getting routine screening or treatment during the lockdown, those might not show up until some time hence.
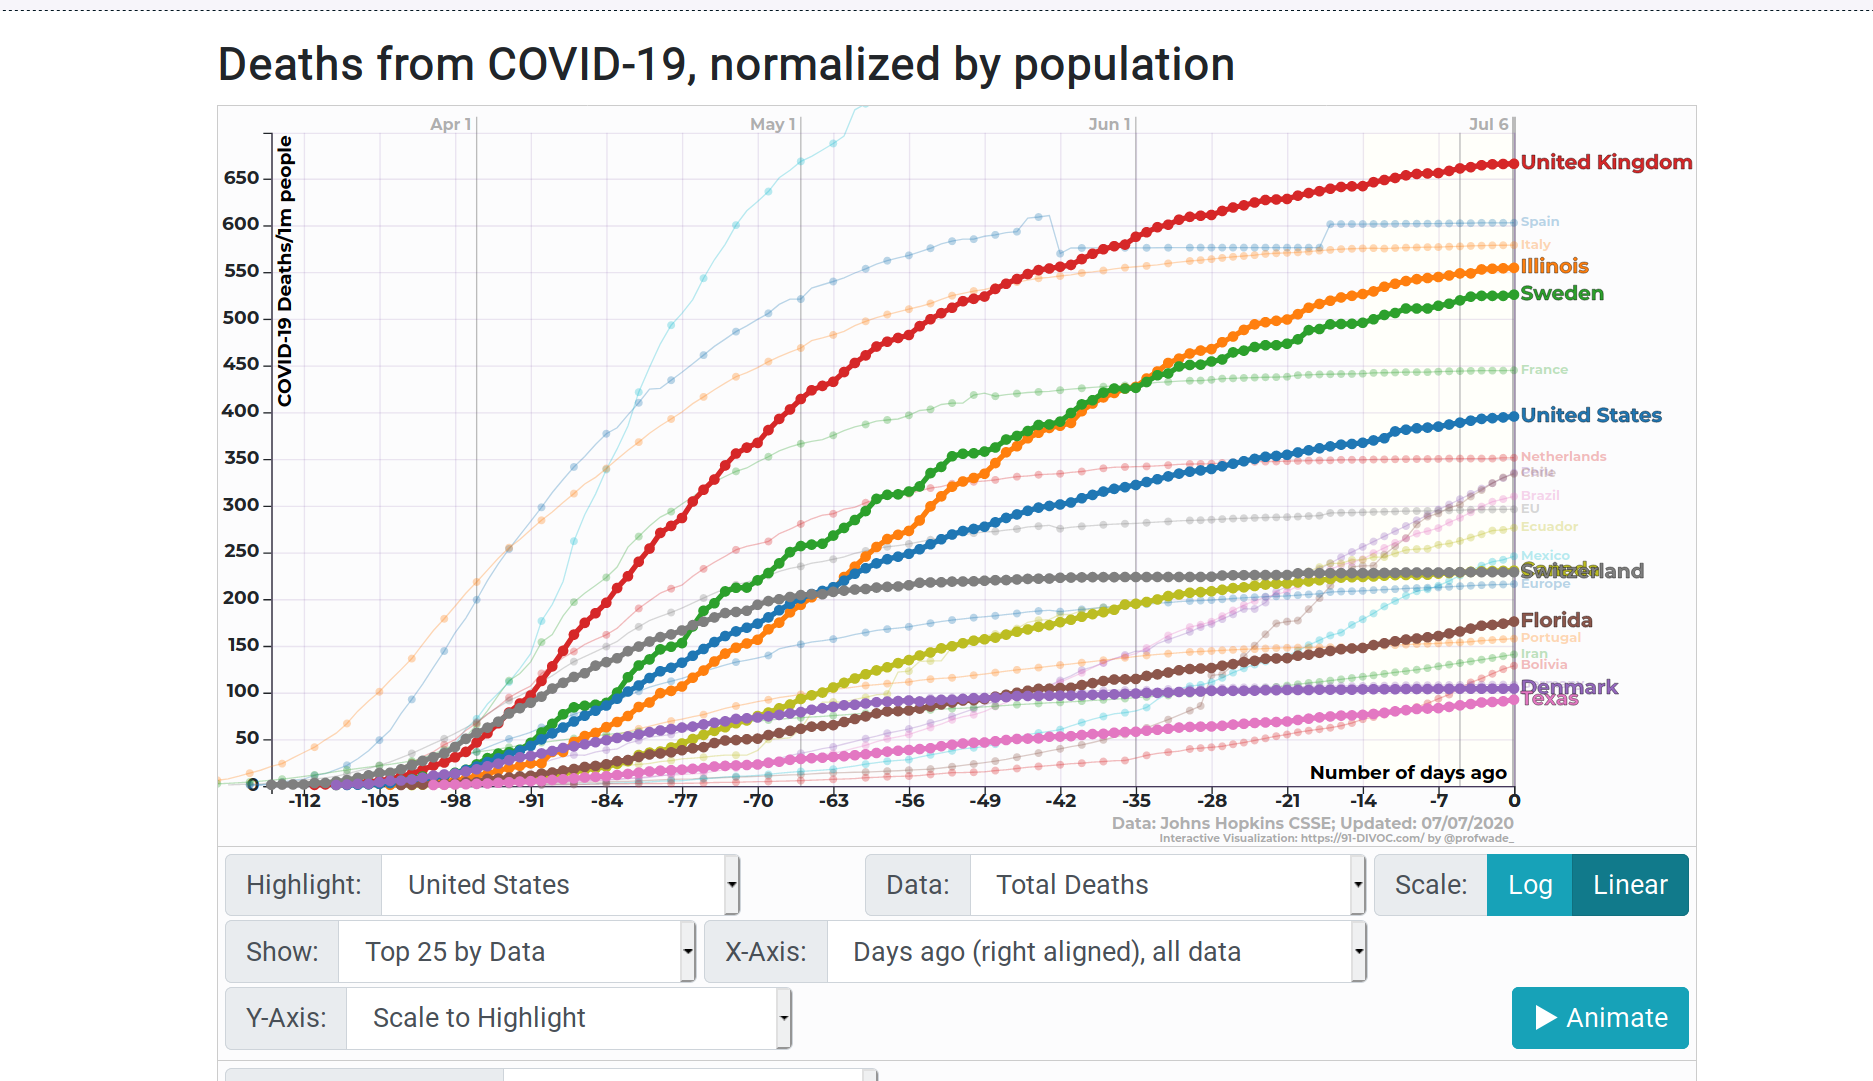
(The country you can’t see, overwritten by Switzerland, is Canada.) What I make of this is that maybe the Swedish approach, relatively unrestricted, works about as well as the Illinois approach, pretty locked down except for big demonstrations. Otoh, if the Danes are similar to Swedes, then the former nation’s lockdown might have been quite helpful in reducing deaths. To a level almost as low as Texas, tho we’ll see how that works out in the coming month or so.
Go play with the site, recently enhanced to allow comparisons between U S states and nations. It’s great fun.
According to this post, Japanese don’t expect the value of their houses to grow. It seems that they routinely recognize the house and land as separate purchases, and after a few decades the house might have no value at all. The inference is that land value also might not increase, but at least is unlikely to drop much. (Of course the same trends in value occur in the U S, but we tend not to recognize it.)
As a result, empty-nesters in Japan don’t count on funding their retirements by selling their houses. As noted in the comments, this also means that housing in Japan is much more affordable than in North America.
Another post by the same writers observes that vacant land in Japan is subject to very high taxes — six times the rate for land with structures. So landowners are reluctant to demolish worthless houses. The result is over 13% of houses (as of 2013) were vacant, many of them deteriorated and uninhabitable. (This article asserts that Japan had 8.5 million “abandoned homes” in 2018, but provides no source and doesn’t define “abandoned.” This table from the Japan Statistics Bureau reports 8,764,400 vacant dwellings, 14% of Japan’s housing. Most are “for sale” or “for rent.” )
14% seems like a lot, but the equivalent U S rate is 12.2% (according to the press release here which might soon be memory-holed in favor of an update.)
We already knew that computers, equipped with proper algorithms, could write stories pretty much indistinguishable from the work of professional journalists working under deadline pressure. And had I been paying attention, I’d know that the company behind this, a “spinout” from Northwestern University, is also moving into other “turn data into a story” tasks, which from the examples here seem to mainly focus on financial reporting, tho it also appears that buyers of used cars can be exposed to “automated and individualized vehicle stories” (pdf) about their cars, which presumably helps sales. And it’s no secret that In Q Tel, an affiliate of your Central Intelligence Agency, is one of several investors behind the company.
So, it’s technology, it’s government, it’s marketing– why am I surprised that it’s protected by a bunch of patents on different variations on “automatic generation of a story?” Here I am, using a computer with many automatic functions to generate a sort of story about this company, and I really haven’t time to read and try to understand all their patents. I guess I better stop before I get in more trouble.
A new report “Copyright Industries in the U S Economy” has been released by the IIPA (A conspiracy of seven associations of copyprivilege holders). I should read and review it, but I could not do a better job than Mike Masnick, so read his review and the comments thereon. Of course, IIPA and its members probably have several staff and/or automatons, whose duties include responding to constructive comments. Fortunately, they get responded to in turn.
“In order to preserve and enhance jobs, exports and economic contributions, it is critical that we have strong legal protections for U.S. creativity and innovation in the U.S. and abroad.”
Which means creators need to be free to create, with strong legal protection against those who would try to prevent their use of ideas which may have been touched by others.
The focus on small business makes sense, since folks on payrolls or pensions generally can’t hide much of their income, and large corporations can obtain legislative action or legal advice providing their own loopholes. Two surveys were done, one of small businesspeople nationwide for whom, statistically, an audit would be expected to result in additional tax payments, and the other of small businesspeople in communities from which a high proportion of such returns was filed. (NOTE: When wooing their votes we call them “entrepreneurs” or “job creators,” but that would not be dainty when we are considering them “tax cheats.”) These “low compliance” folks were supplemented by a survey of those expected to be “high compliance.”
I see two surprising results in this report. First, on most attitude measures there’s little difference between the “low compliance” and “high compliance” respondents. For example, only 15% of the “low” group thought that federal tax laws were fair, and the same proportion of the “high” group agreed. Differences that did appear were fairly small. “Wealthy taxpayers minimize their taxes in ways the average taxpayer cannot” was agreed with by 74% of the “low compliance”‘ group, and 69% of the “high compliance” people.
An even bigger surprise, to the IRS analysts as well as this blogger, is that “low compliance” seems to be associated with greater participation in their local communities, including churches, schools, volunteer organizations, and even were more likely to vote than “high compliance” people. I hesitate to speculate on what this means, but it is probably a positive for those of us who believe (along with most respondents) that federal government is not an appropriate way to deal with many of the areas it has become involved in.
The report acknowledges that the survey suffers from an indirect method: “Low compliance” merely indicates a statistical likelihood of same, not an actual lack of compliance by the respondent. Because a random selection of taxpayers are audited simply to calibrate the compliance-prediction model, it would have been possible to target these particular taxpayers for the survey. Of course they couldn’t be surveyed after their audits because they might be especially unhappy with IRS at that point. But they could have been surveyed just before being notified on the audit. IRS decided not to do that because they “deemed it overly deceptive.” However, the actual survey (done over the phone by a contracted private company), did not reveal that this was an IRS project until the conclusion, after the data had been gathered. That apparently was deemed just deceptive enough.
Not part of the published report is a list of “clusters of potential tax cheats” posted by AP but presumably originating with IRS. Apparently tabulated by zip code, here’s the Illinois portion of the list:
Bellwood, Calumet City, Dolton, Grand Crossing, Hazel Crest, Matteson, Maywood, Ogden Park, Phoenix, Riverdale, Roseland, South Chicago Heights, South Holland, University Park. I assume that folks in Oakbrook and Barrington Hills had already purchased their own loopholes.
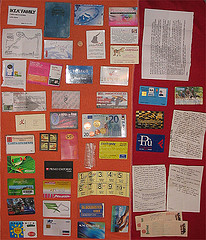
Measuring inflation isn’t an easy matter; I don’t think many of us can even agree on exactly what inflation is. But it’s somehow related to prices consumers pay, and the biggest operation measuring that, at least in the U S, is the Bureau of Labor Statistics’ Consumer Price Index. There are lots of issues with how they measure, and how they report, but one which I haven’t seen discussed regards “loyalty” cards and the value of privacy.
Many retailers in recent years have set up “clubs” of one sort of another to better track their customers. One of the noteworthy exceptions until last year was Walgreens, and there remain a few other respectablemerchants, but nowdays one who chooses not to participate ends up giving up a fair amount of money (or convenience). So does the Consumer Price Index recognize that privacy has a price?
The answer, at least conceptually, turns out to be straightforward. It’s right here in Chapter 17 of the Handbook of Methods. As described on pages 31-32 of this pdf, if a discount is offered only to card users, is temporary (lasts no longer than a month or two), and at least 50% of the sales are at the discounted price, then the CPI recognizes the discounted price. (If the discount is for a longer period, then pro-rata weighting is used.) In essence, if most people give up privacy for a discount, then the CPI doesn’t recognize this as a cost.
At least in the stores I visit, it seems that most folks are quite willing (or economically constrained) to take the discount; anyone who wants to make a purchase under the policies that were in place twenty years ago needs to pay a higher price, which is not recognized in the Consumer Price Index.