Cheap housing is on cheaper land

Click for larger, interactive map

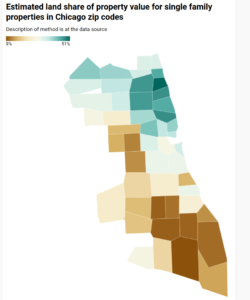
UPDATE Aug 29 2021:  If anyone familiar with Chicago doubts that removing improvements from the tax base will ease the burden on low-income homeowners, this map will be instructive.   The original, mapless post from Aug 25 follows.

We sometimes are told that a land value tax (LVT) would punish the poor person who has a small rundown house on a high-value lot, while benefiting the person next door who has a large fancy house on an identical lot. And that’s not wrong, it’s just atypical.  In practice, we believe, poor people mostly live in neighborhoods where housing is cheap and land is cheaper, thus they would tend to benefit from a shift to LVT.

As the quality of Cook County assessments has been improving, we expect to be able to show this by analysis of that data. In the meantime, we have some estimates of land and improvement value from William Larson and colleagues at the Federal Housing Finance Agency.  Using appraisals produced for mortgage underwriting, they estimate land and improvement values for homes in most zip codes (and census tracts) nationwide.  Their source data includes only single family properties which were appraised for mortgage purposes.  They consider only parcels where the improvement is less than 15 years old, and exclude vacant land as well as land where the appraised value is very close to the assessed value (in case appraisers might have relied on low-quality or obsolete assessments).  Also excluded are zip codes with an insufficient number of single family home transactions.

The chart below shows, for Chicago zip codes, the ratio of land value to total value (vertical axis) and total value of the property (horizontal axis. What stands out is that the ratio tends to be lower where the properties are cheaper.  That is, a revenue-neutral shift of property taxation to land values only, ignoring value of improvements, would tend to reduce the taxes on low-value zip codes, while increasing it in higher-value areas.


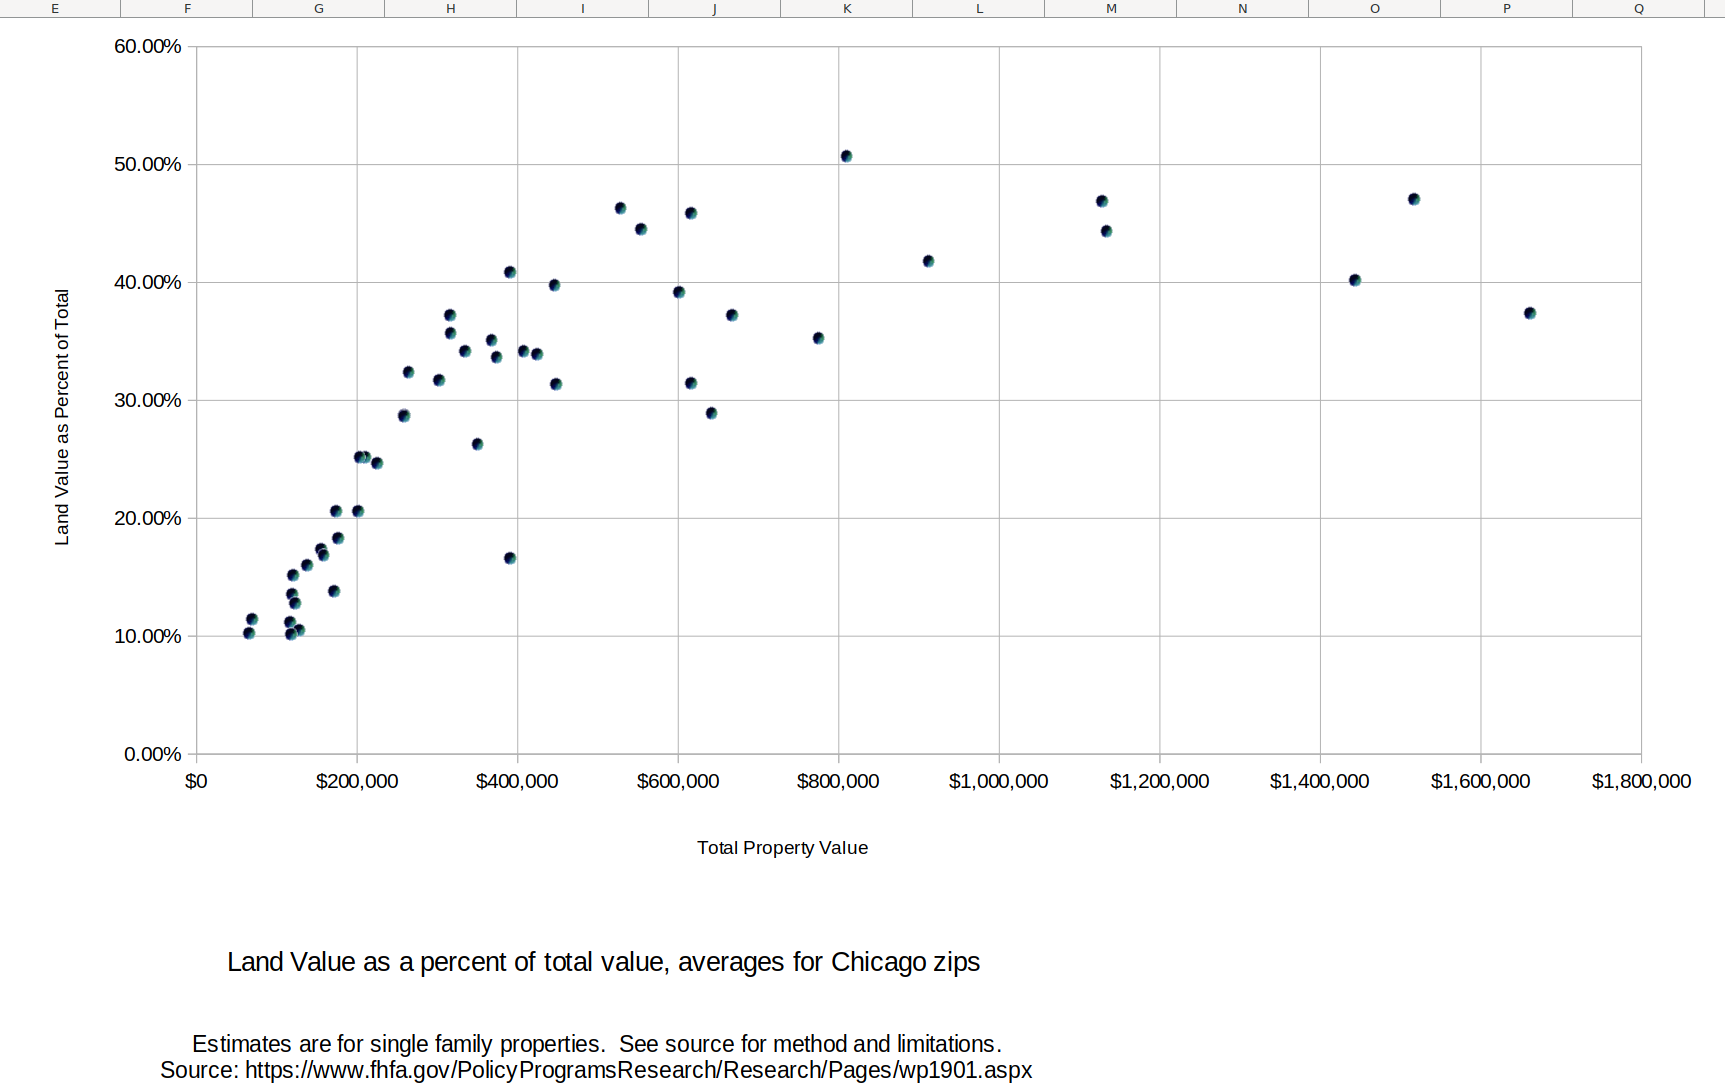
The table below shows the data for each zip code, sorted from high proportion of value in land to low.   Clearly the more affluent areas have lower proportion of improvement value, and the areas with low income population have a higher proportion of improvement value.

Estimated land value proportion and related data for single family properties in Chicago zip codes
ZIP Code Lot Size building sq ft floor area ratio Property Value (As-is) Land Share of Property Value
60640 4300 2320 0.540 $809,500 50.70%
60614 2920 2950 1.010 $1,516,300 47.10%
60613 3740 2590 0.693 $1,128,200 46.90%
60625 4220 1860 0.441 $528,000 46.30%
60618 3580 1890 0.528 $615,800 45.90%
60660 3820 1940 0.508 $553,500 44.50%
60657 3210 2600 0.810 $1,133,300 44.40%
60622 3120 2330 0.747 $911,800 41.80%
60631 5620 1690 0.301 $390,700 40.90%
60610 2250 2900 1.289 $1,443,300 40.20%
60646 5370 1820 0.339 $445,900 39.80%
60647 3250 1880 0.578 $600,800 39.20%
60654 1990 3580 1.799 $1,661,200 37.40%
60630 4310 1550 0.360 $315,500 37.20%
60642 2230 2140 0.960 $667,200 37.20%
60641 4230 1640 0.388 $316,400 35.70%
60605 1840 2200 1.196 $774,700 35.30%
60659 4310 1800 0.418 $367,500 35.10%
60626 5410 2050 0.379 $407,400 34.20%
60656 5100 1500 0.294 $334,600 34.20%
60612 2910 1920 0.660 $424,300 33.90%
60645 4420 1870 0.423 $373,600 33.70%
60634 4240 1470 0.347 $264,100 32.40%
60608 2960 1530 0.517 $302,200 31.70%
60615 4460 2630 0.590 $615,700 31.50%
60616 2570 1950 0.759 $447,900 31.40%
60607 1970 2140 1.086 $641,400 28.90%
60655 5140 1490 0.290 $258,000 28.80%
60707 4940 1600 0.324 $258,700 28.70%
60637 3920 1970 0.503 $350,000 26.30%
60609 3320 1450 0.437 $209,700 25.20%
60639 3900 1420 0.364 $202,900 25.20%
60638 4280 1340 0.313 $225,100 24.70%
60632 3860 1300 0.337 $173,600 20.60%
60643 5960 1600 0.268 $200,800 20.60%
60652 4730 1330 0.281 $176,400 18.30%
60629 4040 1340 0.332 $155,300 17.40%
60651 3920 1440 0.367 $158,300 16.90%
60653 3290 2360 0.717 $390,100 16.60%
60644 4580 1650 0.360 $137,400 16.00%
60633 4690 1320 0.281 $120,200 15.20%
60649 4960 1870 0.377 $170,800 13.80%
60623 3510 1340 0.382 $118,500 13.60%
60624 3300 1540 0.467 $122,200 12.80%
60621 3880 1490 0.384 $69,300 11.50%
60617 4200 1360 0.324 $116,300 11.20%
60619 4320 1430 0.331 $127,700 10.50%
60636 3540 1270 0.359 $65,200 10.30%
60620 4180 1410 0.337 $117,800 10.20%
60628 4320 1340 0.310 $99,800 9.20%
source: https://www.fhfa.gov/PolicyProgramsResearch/Research/Pages/wp1901.aspx

A Chicago zip code map is here.

Also of interest, even tho the low-value areas have a high ratio of improvement to land value, this isn’t because of large houses on small lots.  The floor area ratio is generally lower in the areas with lower land value proportion.

Overall, the above data is consistent with Georgists’ assertion that low-income residents usually benefit from a switch to LVT.  I might be taking a further look at this dataset.

Distributing privilege differently

Some land in Woodlawn (15 years ago). Image credit: Eric Allix Rogers CC BY-NC-ND 2.0

A D Quig reports in Crains that the City of Chicago’s Housing Commissioner  says “everyone who lives in Woodlawn now should be able to stay in Woodlawn.”  This can be a challenge as housing costs in the area rise.  According to Crains (not corroborated by any press release I can find on web sites of the Department of Housing or the Mayor’s Office), support for housing affordabiity in the area will involve six strategies:

  • Right of refusal for large apartment building tenants if a landlord seeks to sell his or her building
  • Helping apartment building owners refinance properties to keep renters in place with affordable rates
  • Giving grants to long-term homeowners to help with home repairs
  • Financing the rehab of vacant buildings
  • Setting guidelines for how city-owned, vacant, residentially zoned land can be developed into affordable or mixed-income housing
  • Requiring developers that receive city-owned land to meet enhanced local hiring requirements

Details, of course, are yet to be defined, and the whole thing requires action by the City Council.  Still, assuming that the program is effectively structured and implemented, what we have is the designation of a privileged class– people who live in Woodlawn– receiving benefits that might otherwise accrue to another privileged class — people who own land in Woodlawn, with a new layer of bureaucracy established (or repurposed) to administer it, including investigating and monitoring the reported income and behavior of the people who are granted permission to live in the area.

Whereas, under a land value tax, the area would now have little vacant land, presumably a lot more housing, probably quite “affordable.”

Of course if you’re the Mayor, you do what you figure is politically feasible and within your power, not what is morally right and economically efficient, but would require persuading a lot of uninformed voters and obtaining cooperation from quite a few other governmental actors.

Some effects of high and misconfigured real estate taxes

Delinquent taxes soaring in Cook County

Reportedly, taxes of 163,036 parcels in Cook County were not paid on time. This comprises 2018 taxes which should have been paid in 2019. and amounts to 8.7% of all parcels in the County. For a dozen south Cook County municipalities, this amounts to 20% or more of total parcels.  Counts by municipality are posted separately for south, west, and north Cook.  All sources show the percentage of parcels with unpaid taxes within the City of Chicago as 9.9%.

Separately, the reports show that only 7.8% of the delinquent taxes offered for auction in 2018 were bought by investors, which might imply that the remaining parcels are considered worth less than the taxes owed.

Unfortunately the source doesn’t tell us  how many of the parcels are vacant, residential, commercial, or other uses, and gives no historical context, so we don’t really know how any of these figures compare to prior years. But regardless, the current numbers are alarming.

Suppose that the real estate tax system was changed, so that improvements would be tax-free while the value of land as vacant would be heavily taxed to make up the difference.  For vacant parcels, construction of houses or other structures would not increase the tax.  For parcels which contain improvements, taxes likely would be lower than now, and improvements would again be tax free.  Just a thought.

Maybe expanding tax-exempt institutions raise land prices?

Crains tells us that a strikingly-designed two flat, less than 30 years old, is worthless.  Well, they didn’t say it quite that way, but it was sold for $1.9 million to a buyer who will demolish it. So the $1.9 million was for the land.  I don’t know whether any developer of housing or anything else taxable would have paid nearly that much for the site, but the buyer was tax-exempt Illinois Masonic Medical Center.  Their exempt status of course made the land more valuable to them. Which raises the interesting question of whether buying land in the path of such an institution’s expansion might be a profitable strategy.  Of course, a fair-minded community might decide to tax land used for hospitals at the same rate as land used for housing and other useful things.  But we’re not there yet.

“Taxes – De Standaard” by Stijn Felix is licensed under CC BY-NC-ND 4.0


Putting government pension costs into perspective

Wirepoints recently issued a helpful report showing state and local government pension debt per Chicago household.  They estimate the burden at $144,000 per household.  This is a big number, but one could suppose that a prosperous household, over decades, could bear such a burden.  Some could, but probably not those below poverty level.  Take them out of the picture and the per household amount rises to $172,000.  Excluding households with incomes below $75,000, or below $200,000, and the per-household amount rises further, to $393,000 and $2,022,000 respectively.

Here’s their chart: pension debt chart

Of course this doesn’t consider land values, nor businesses.  If prime Chicago land is worth $1,000/sq ft, that’s 5.38 sq miles.  But more typical land value is much less, probably no more than $25/sq ft. (it seems that nobody has tried to estimate citywide values). That would be 112 square miles.  Once we subtract land owned by governments, churches and other exempt nonprofits, we might be approaching the total value of all land in Chicago. And that’s just for pensions, not bonded debt, nor needed capital improvements.  Real estate buyers know, or certainly should know, about these encumbrances.

Of course money can be raised from business taxes, but that’s hardly a way to grow economic opportunity for Chicagoans. I would consider any tax revenue from “gaming” as a kind of business tax.

The lesson Wirepoints draws from this is that pensions have to be downsized somehow, which required amending the state constitution.  And they go further, comparing government salaries to those of the private sector:

some local gov't salaries compared to average workers

So it looks like we’re going to have to confront a large number of people with guns and firehoses and control over our children, who have been getting a lot of money from us for years and may prefer not to moderate their demands.

Tho I don’t know how, this problem will be solved. Maybe MMT will yield a continuing stream of funds to bail us out.  Maybe inflation will accelerate such that the fixed 3% compounded pension increase isn’t a burden.  Maybe Chicagoans will decide that they just don’t want so many government “services.”  Maybe politicians will decide to remove all taxes from productive economic activity, taxing only the value of land and other privileges (such as the private monopoly over street parking fees), which will grow the economy (while reducing the need for emergency services) sufficient to make pensions a non-issue.

And when it is solved, those who own land and other privileges will benefit most.

In Japan, folks know that houses depreciate

image credit: insho impression CC BY-ND 2.0

According to this post, Japanese don’t expect the value of their houses to grow.  It seems that they routinely recognize the house and land as separate purchases, and after a few decades the house might have no value at all.  The inference is that land value also might not increase, but at least is unlikely to drop much. (Of course the same trends in value occur in the U S, but we tend not to recognize it.)

As a result, empty-nesters in Japan don’t count on funding their retirements by selling their houses.  As noted in the comments, this also means that housing in Japan is much more affordable than in North America.

Another post by the same writers observes that vacant land in Japan is subject to very high taxes — six times the rate for land with structures.  So landowners are reluctant to demolish worthless houses.  The result is over 13% of houses (as of 2013) were vacant, many of them deteriorated and uninhabitable.    (This article asserts that Japan had 8.5 million “abandoned homes” in 2018, but provides no source and doesn’t define “abandoned.”  This table from the Japan Statistics Bureau reports 8,764,400 vacant dwellings, 14% of Japan’s housing. Most are “for sale” or “for rent.” )

14% seems like a lot, but the equivalent U S rate is 12.2% (according to the press release here which might soon be memory-holed in favor of an update.)


Some Cook County assessments are maybe about as bad as we thought

We have a new report(pdf) today from the Civic Consulting Alliance, pointing out that residential assessments  (excluding condominiums and large apartment buildings) done by Joe Berrios and his crew are of poor technical quality, don’t make effective use of modern techniques, and tend to treat expensive properties more leniently than less expensive ones.  The Tribune article gives pretty good context and describes the contents of the report, so I won’t try to duplicate it. Rather, I’ll focus on just a few things that caught my eye.

The study uses data that apparently has never been made public.  That is, it belongs to the public as represented by Joe Berrios, but the public hasn’t been permitted to see it.  And we’re still not permitted to see it.  In fact, the consultants and the Assessor seem to have spent more than two months negotiating a five-page nondisclosure agreement (reproduced at the end of the report) to make sure we wouldn’t see it. But we are able to see some detailed analysis, in the study appendix, that’s more useful than the raw data for understanding how assessments actually work.

We get some useful detail on the bias in favor of expensive properties.

The above figure, which is Appendix Table 5 in the report, shows the inaccuracy (left half, shorter bar means less inaccurate) and bias in favor of expensive properties (right half, shorter bar means less bias).    We can see that the bias in favor of expensive properties exists for all four categories, but is  most serious for multi-family and mixed-use (residential with a storefront, for example).  But for such properties, there’s no reason to expect that the expensive property contains the wealthier taxpayer.

Also as previously observed, the report notes that more appeals are filed by owners of more expensive properties:

This implies that wealthier homeowners are getting a bigger tax break, proportionally, than less wealthy homeowners. I suspect it’s true, but I really don’t see any way around it within the current assessment system.  The wealthier homeowner has more to gain from a successful appeal (or, what is the same thing, more to lose by failing to appeal.)  She may also be more comfortable dealing with government officials and forms (and perhaps with the tax lawyers who send mailings to homeowners).

But isn’t the same true of the income tax? The wealthier taxpayer is more likely to know, or learn, tax-avoidance tricks, and/or to use a skilled tax preparer.   The difference is that parcel-level assessment data is, to some extent, public information, but income tax returns in the U S no longer are.

Of course the main remedy for problems of inequitable assessments comprises:

(1) Assess only land value, ignoring the value of any improvements on the parcel.

(2) Post the assessments, including all information used to calculate them.


Extreme land value follies in Vancouver

Credit: tglucas500 via flickr
Credit: tdlucas5000 via flickr

Up in Vancouver BC, analyst Jens von Bergmann calculates that the increase in land value for single family houses over the past year exceeded the total income earned by the entire population of the City.  Median increase was $262,000, average was $318,877.  Von Bergmann estimates this to be equivalent to $126/hour, assuming people work a 40 hour week 62 weeks per year (allowing for multiple-worker households).  By comparison, actual labor yields an average income of $26/hour (all figures in multicolored Canadian dollars, of course).

But the land price appreciates every hour of every day, so it might make more sense to calculate the median increase as $29.89 (mean $36.38) per hour.

Of course this cannot continue indefinitely, but something like it has been going on for a long time in Vancouver, as well as a few other cities.  Wealthy international buyers from less stable places want a refuge, as well as perhaps an investment.  But even this group, depending on developments overseas, must eventually be limited.  Some analysts — Garth Turner comes to mind — have been warning of a crash for years and years.

What really impresses me about von Bergmann’s analysis is that BC assessment authorities appear to do a decent job of estimating land value, and making the data broadly available.  It’d be worth something to live in a place like that.

h/t Wealth and Want.

Low wages mean low productivity

source: Wikimedia Commons

[L]abor is most productive where its wages are largest. Poorly paid labor is inefficient labor, the world over…. The efficiency of labor always increases with the habitual wages of labor—for high wages mean increased self-respect, intelligence, hope, and energy.

–Henry George (Progress & Poverty, Book IX, Chapter 2)

George gives plenty of examples from his time, but modern examples abound too.  I happened on a 2006 article (pdf) by Wayne Cascio comparing how Sam’s Club and Costco treat their labor.  The short answer is: Costco treats their workers much better, including higher wages, better benefits, and more job security. And, the article continues, the results are consistent with Henry George. Based on 2005 data,

 Costco’s hourly labor rates are more than 40 percent higher than those at Sam’s Club ($17 versus $10.11), but when employee productivity is considered (sales per employee), Costco’s labor costs are lower than those at Sam’s Club (5.55 percent at Costco versus 6.25 percent at Sam’s Club).

Similar differences are cited in sales per square foot, and operating profit per employee.  Obviously, the figures nearly a decade later would be different, but I suspect the comparison would be similar.

It matters how we own what nobody produced

Tenant farmers paid rent here

[I]n Bill Clinton’s encapsulation of political strategy, “It’s the economy, stupid.” But the success of an economy can only be measured by its growth.  Since growth requires the accelerated consumption of limited natural resources, it is not a sustainable model in the long run.

If you concentrate on how a place is owned, however, the perspective changes.  As this book demonstrates, matters of laws, of rights and of politics become crucial, taking precedence over economics.  From that point of view… “It’s the neighborhood, stupid.”

…Around the world and throughout history, neighborhoods have succeeded in a million different ways.  It all depends on how the earth is owned.

That, the conclusion of Andro Linklater’s Owning the Earth, illustrates what is right and what is wrong with the book.  Our quality of life does does depend on how the earth is owned, and Georgists are aware of the importance and practicality of recognizing each individual’s right to what no one produced. But must a sound economy necessarily use more of the earth’s limited resources? Is there no practical way to use resources more efficiently? And is there no possibility that economic improvement could be measured by anything other than economic growth?

The book is wide-ranging and (mostly) well-written, making connections in place after place between how the right to use nature is recognized, and how well the community developed. It draws some connections that I hadn’t seen before, such as how the growth in mortgages on American farms followed logically from the end of homesteading.

And Linklater does devote a couple of pages to Henry George, but seriously misunderstands why George’s proposals weren’t widely adopted, saying  “[I]t is notoriously difficult to arrive at a valuation system that can clearly separate earned from unearned capital appreciation.” Here he means “separate improvement value from land value,” and he is wrong.  Practical methods of doing so on a mass basis were described back in 1970 in TRED #5  (outline), which is not posted on line to my knowledge, and in this more recent paper by Ted Gwartney, MAI.   And, of course, land values are routinely estimated by appraisers and are a component of almost every U S income tax return that involves commercial or investment real estate.

It is true that, with limited exceptions, George’s proposals weren’t adopted, but for a different reason.  Mason Gaffney has provided a compelling and well-sourced explanation (also available in a book), and it is unfortunate that Linklater seems to have been unaware of it. One wonders what else he did not know.

March 1 2015 update: I just discovered that Ed Dodson has produced a more thoughtful and detailed review of Linklater’s book.