Three “finalist” proposals for fixing Chicago’s pension mess

image credit: Artistmac

We have an article from Crains  reporting on the winning proposal for solving the disaster that is the City of Chicago’s pension plans.  Of course a new fee is involved, being a toll on DLSD.  Article doesn’t disclose how much this toll would be, nor its likely impact on traffic.  I suspect that parallel arterials would see increased congestion, while DLSD itself might flow a lot better with reduced traffic volumes.

The two runners-up proposed income tax increases.  One would be a 1% income tax on the remaining Chicagoans, to be termed a “public safety tax” and used to fund police and fire departments, freeing up municipal funds to go to pensions. The other proposed raising the State income tax to 6%.

There were originally eight proposals, and perhaps one of the losing five made the logical proposal– a tax on whoever controls on-street parking. Like any real estate tax, this would be based on the value of the control, and should be set such that LAZ Parking can retain just enough profit to operate the system.  .The Sun-Times’ Fran Spielman said LAZ grossed $136.2 million in 2021).

A tax collecting most of that annually could make a significant dent in $35.4 billion shortfall recently estimated for the City’s pension funds, tho it couldn’t cover the entire need. And that doesn’t include Chicago Public Schools, Cook County, State of Illinois, and other government pension funds which are in difficulty.

All these proposals come from students at UChicago’s Harris School of Public Policy.  Which somehow reminds me of the remark decades ago from Mike Royko, observing that Hyde Park isn’t really part of Chicago, but rather a sixth boro of New York.
Cheap housing is on cheaper land

Click for larger, interactive map

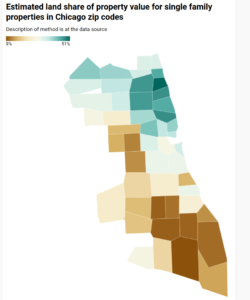
UPDATE Aug 29 2021:  If anyone familiar with Chicago doubts that removing improvements from the tax base will ease the burden on low-income homeowners, this map will be instructive.   The original, mapless post from Aug 25 follows.

We sometimes are told that a land value tax (LVT) would punish the poor person who has a small rundown house on a high-value lot, while benefiting the person next door who has a large fancy house on an identical lot. And that’s not wrong, it’s just atypical.  In practice, we believe, poor people mostly live in neighborhoods where housing is cheap and land is cheaper, thus they would tend to benefit from a shift to LVT.

As the quality of Cook County assessments has been improving, we expect to be able to show this by analysis of that data. In the meantime, we have some estimates of land and improvement value from William Larson and colleagues at the Federal Housing Finance Agency.  Using appraisals produced for mortgage underwriting, they estimate land and improvement values for homes in most zip codes (and census tracts) nationwide.  Their source data includes only single family properties which were appraised for mortgage purposes.  They consider only parcels where the improvement is less than 15 years old, and exclude vacant land as well as land where the appraised value is very close to the assessed value (in case appraisers might have relied on low-quality or obsolete assessments).  Also excluded are zip codes with an insufficient number of single family home transactions.

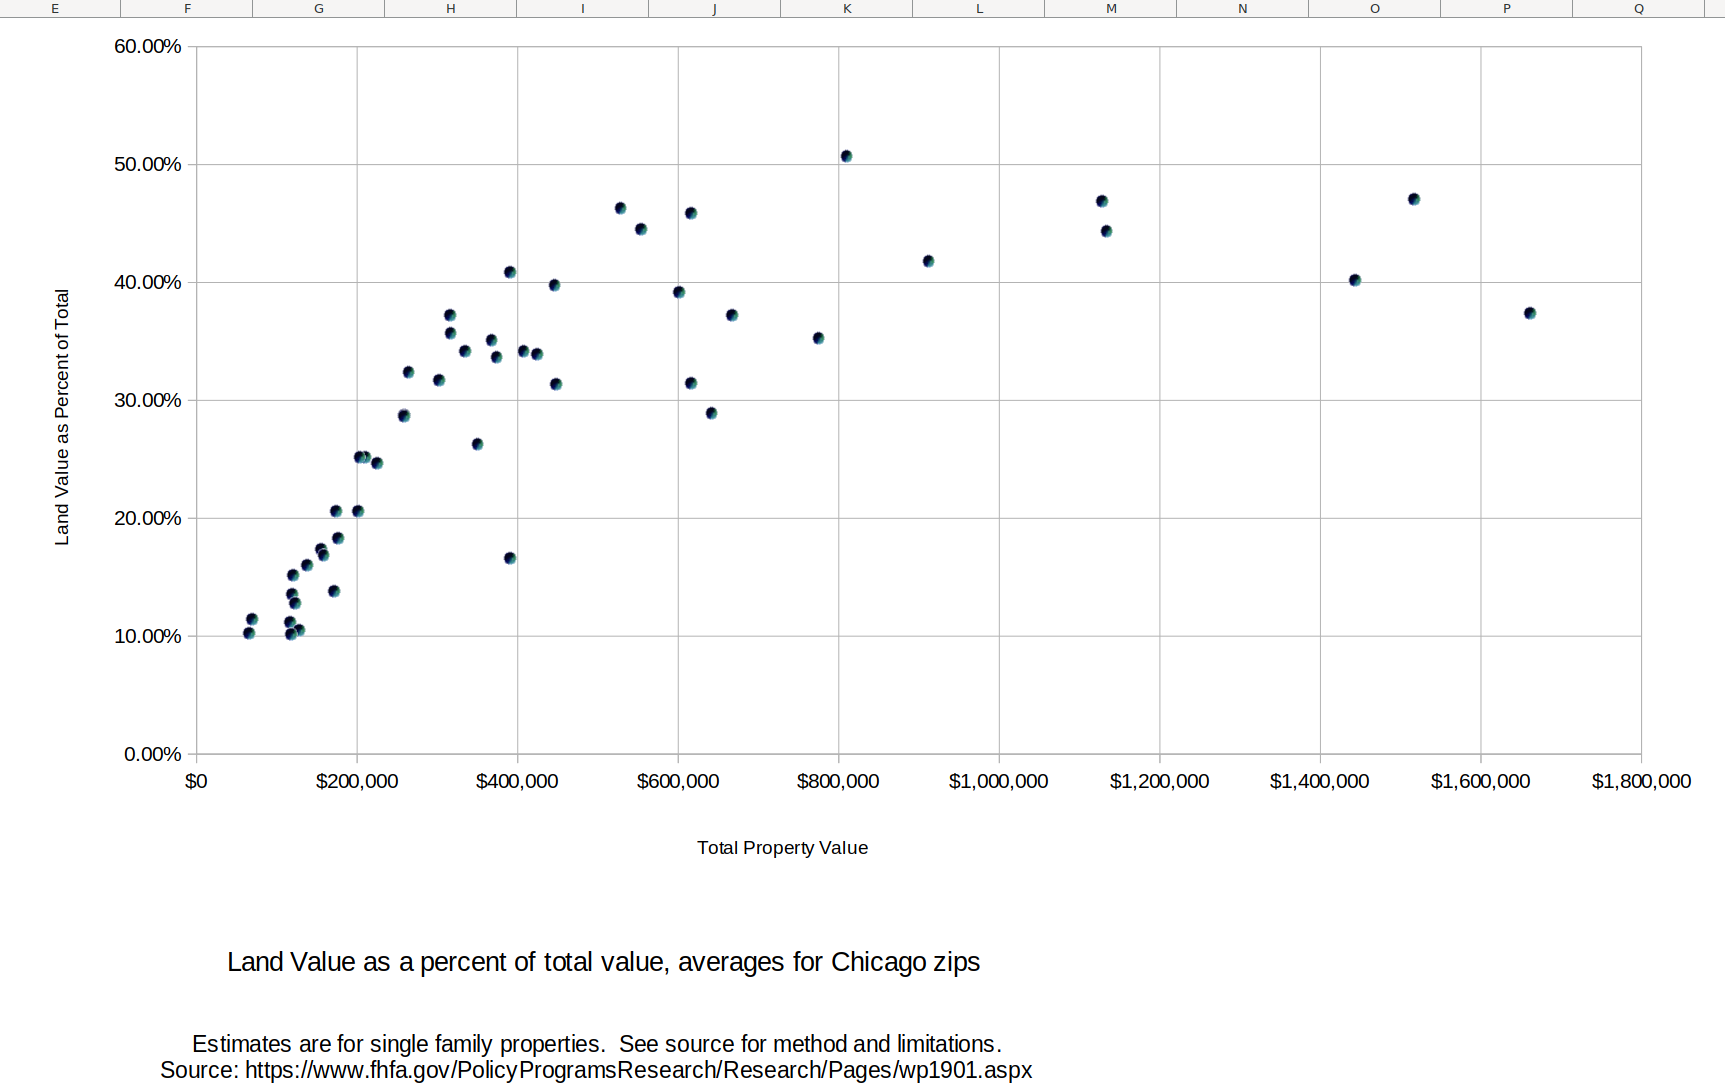
The chart below shows, for Chicago zip codes, the ratio of land value to total value (vertical axis) and total value of the property (horizontal axis. What stands out is that the ratio tends to be lower where the properties are cheaper.  That is, a revenue-neutral shift of property taxation to land values only, ignoring value of improvements, would tend to reduce the taxes on low-value zip codes, while increasing it in higher-value areas.


The table below shows the data for each zip code, sorted from high proportion of value in land to low.   Clearly the more affluent areas have lower proportion of improvement value, and the areas with low income population have a higher proportion of improvement value.

Estimated land value proportion and related data for single family properties in Chicago zip codes
ZIP Code Lot Size building sq ft floor area ratio Property Value (As-is) Land Share of Property Value
60640 4300 2320 0.540 $809,500 50.70%
60614 2920 2950 1.010 $1,516,300 47.10%
60613 3740 2590 0.693 $1,128,200 46.90%
60625 4220 1860 0.441 $528,000 46.30%
60618 3580 1890 0.528 $615,800 45.90%
60660 3820 1940 0.508 $553,500 44.50%
60657 3210 2600 0.810 $1,133,300 44.40%
60622 3120 2330 0.747 $911,800 41.80%
60631 5620 1690 0.301 $390,700 40.90%
60610 2250 2900 1.289 $1,443,300 40.20%
60646 5370 1820 0.339 $445,900 39.80%
60647 3250 1880 0.578 $600,800 39.20%
60654 1990 3580 1.799 $1,661,200 37.40%
60630 4310 1550 0.360 $315,500 37.20%
60642 2230 2140 0.960 $667,200 37.20%
60641 4230 1640 0.388 $316,400 35.70%
60605 1840 2200 1.196 $774,700 35.30%
60659 4310 1800 0.418 $367,500 35.10%
60626 5410 2050 0.379 $407,400 34.20%
60656 5100 1500 0.294 $334,600 34.20%
60612 2910 1920 0.660 $424,300 33.90%
60645 4420 1870 0.423 $373,600 33.70%
60634 4240 1470 0.347 $264,100 32.40%
60608 2960 1530 0.517 $302,200 31.70%
60615 4460 2630 0.590 $615,700 31.50%
60616 2570 1950 0.759 $447,900 31.40%
60607 1970 2140 1.086 $641,400 28.90%
60655 5140 1490 0.290 $258,000 28.80%
60707 4940 1600 0.324 $258,700 28.70%
60637 3920 1970 0.503 $350,000 26.30%
60609 3320 1450 0.437 $209,700 25.20%
60639 3900 1420 0.364 $202,900 25.20%
60638 4280 1340 0.313 $225,100 24.70%
60632 3860 1300 0.337 $173,600 20.60%
60643 5960 1600 0.268 $200,800 20.60%
60652 4730 1330 0.281 $176,400 18.30%
60629 4040 1340 0.332 $155,300 17.40%
60651 3920 1440 0.367 $158,300 16.90%
60653 3290 2360 0.717 $390,100 16.60%
60644 4580 1650 0.360 $137,400 16.00%
60633 4690 1320 0.281 $120,200 15.20%
60649 4960 1870 0.377 $170,800 13.80%
60623 3510 1340 0.382 $118,500 13.60%
60624 3300 1540 0.467 $122,200 12.80%
60621 3880 1490 0.384 $69,300 11.50%
60617 4200 1360 0.324 $116,300 11.20%
60619 4320 1430 0.331 $127,700 10.50%
60636 3540 1270 0.359 $65,200 10.30%
60620 4180 1410 0.337 $117,800 10.20%
60628 4320 1340 0.310 $99,800 9.20%
source: https://www.fhfa.gov/PolicyProgramsResearch/Research/Pages/wp1901.aspx

A Chicago zip code map is here.

Also of interest, even tho the low-value areas have a high ratio of improvement to land value, this isn’t because of large houses on small lots.  The floor area ratio is generally lower in the areas with lower land value proportion.

Overall, the above data is consistent with Georgists’ assertion that low-income residents usually benefit from a switch to LVT.  I might be taking a further look at this dataset.

Clobbering fairness more accurately

Where fairness comes from: Cook County Board Pres. Toni Preckwinkle; Illinois House Speaker Michael Madigan (credit: WBEZ CC BY-NC 2.0 and Wikipedia)

We have a new North Suburban Reassessment Report from Assessor Fritz Kaegi. As a “reformer,” this Assessor publishes a lot more information than his predecessors.  In fact, he publishes all the code for his assessment models.

Accurate assessments are said to be important because assessing a property too high can “destroy wealth by diminishing the market value of the property.”  Which is true, but do not taxes based on accurate assessments also destroy wealth?  What the Assessor seems to mean by a “fair” assessment is an assessment that is calculated in accordance with applicable laws and ordinances.  This definition of “fair” comes mainly from our friends in the Legislature and County Board, with some role for other government officials. “Fair” in Cook County means that owners of houses or vacant land should pay taxes at 40% of the rate applied to ordinary industrial or commercial property, unless special favors have been bestowed.  In the rest of the State, “fairness” requires rates in the absence of special favors to be uniform. In all areas, “fairness” requires that religious and most nonprofit educational facilities are entirely exempt from tax. Continue reading Clobbering fairness more accurately

Who should be defunded?

Image credit: Rodney Choice/Choice Photography (CC BY-NC-SA 2.0)

I was only a bit surprised to find that Chicago’s 2020 police budget is $1,778,002,408, or $660 for each of the 2,693,976 folks that DJ Trump’s Census Bureau estimates live in Chicago.  This doesn’t include $737.5 million for the police pension fund, nor $204,867,834 for the Office of Emergency Mgt and Communications, nor $135 million for “judgments and settlements against the City,” (including but not limited to police misbehavior), nor the police-related portion of the City’s capital budget, which seems to include the “joint public safety training academy” ($85 million, but just $15.75 million in the current year), and some other facilities.  All told, and without doing the detailed analysis which I wish the Civic Federation would do, it seems the the City spends something like $1000/person/year for police.  That doesn’t necessarily mean that police should be defunded in whole or in part; after all, reported crime has for the most part been declining, so perhaps we are getting something for our money. But it gives some idea of the dollars involved. (And it turns out that, as I was writing this, the Civic Federation produced a post covering much the same ground, with better context and detail and colorful charts, and noting that I failed to include some undetermined but substantial benefit costs among the cost of police.)

Compare police costs to Chicago Public Schools.  CPS is a separate unit of government, but controlled by the Mayor and funded mainly by Chicago property tax payers.  For the current year, it’s planning to spend $7.84 billion, or $2910 per Chicago resident.  Enrollment continues to decline, 13% in ten years (roughly the same amount as reported crime, but that might just be a coincidence).

Summing the police and school expenses, Chicago spends $3910/person.  For the hypothetical family of four, that’s over $15,000.  I wonder how many two-worker households would prefer to have one stay home, help educate the children, hiring tutors as needed, and keep an eye on the neighborhood, if their income increased by that amount.  Just a thought.

Update September 27:  It turns out I’m not the only one suggesting that we spend too much on government schools.

Putting government pension costs into perspective

Wirepoints recently issued a helpful report showing state and local government pension debt per Chicago household.  They estimate the burden at $144,000 per household.  This is a big number, but one could suppose that a prosperous household, over decades, could bear such a burden.  Some could, but probably not those below poverty level.  Take them out of the picture and the per household amount rises to $172,000.  Excluding households with incomes below $75,000, or below $200,000, and the per-household amount rises further, to $393,000 and $2,022,000 respectively.

Here’s their chart: pension debt chart

Of course this doesn’t consider land values, nor businesses.  If prime Chicago land is worth $1,000/sq ft, that’s 5.38 sq miles.  But more typical land value is much less, probably no more than $25/sq ft. (it seems that nobody has tried to estimate citywide values). That would be 112 square miles.  Once we subtract land owned by governments, churches and other exempt nonprofits, we might be approaching the total value of all land in Chicago. And that’s just for pensions, not bonded debt, nor needed capital improvements.  Real estate buyers know, or certainly should know, about these encumbrances.

Of course money can be raised from business taxes, but that’s hardly a way to grow economic opportunity for Chicagoans. I would consider any tax revenue from “gaming” as a kind of business tax.

The lesson Wirepoints draws from this is that pensions have to be downsized somehow, which required amending the state constitution.  And they go further, comparing government salaries to those of the private sector:

some local gov't salaries compared to average workers

So it looks like we’re going to have to confront a large number of people with guns and firehoses and control over our children, who have been getting a lot of money from us for years and may prefer not to moderate their demands.

Tho I don’t know how, this problem will be solved. Maybe MMT will yield a continuing stream of funds to bail us out.  Maybe inflation will accelerate such that the fixed 3% compounded pension increase isn’t a burden.  Maybe Chicagoans will decide that they just don’t want so many government “services.”  Maybe politicians will decide to remove all taxes from productive economic activity, taxing only the value of land and other privileges (such as the private monopoly over street parking fees), which will grow the economy (while reducing the need for emergency services) sufficient to make pensions a non-issue.

And when it is solved, those who own land and other privileges will benefit most.

Why trust corrupt governments to honestly administer a land value tax?

bar chart of what folks say they're afraid of
source: Chapman University Survey of American Fears

I don’t know that governments are always and inevitably corrupt, but there sure seems to be a lot of corruption going on.  It isn’t a new development; maybe it’s worse nowadays or maybe just more visible.

So how can we single taxers say that we want the government to collect all, or nearly all, of the economic rent? Don’t we know that it will be stolen or, at best, wasted?

Not necessarily.  Consider the following:

In the U S at least, real estate tax is administered and collected at the local — that is, substate– level. This is where the records and expertise needed to operate a land value tax exist.

Unlike income tax or sales tax, nearly all the data involved in real estate taxation is public information.   Most of this data is accessible to everyone with internet access, generally without fee. I can see how much real estate tax my neighbor paid.  I cannot see how much income tax they paid. The same goes for sales taxes and most other kinds of taxes. So cheating in real estate tax can be seen.  That doesn’t mean it will always be impossible for people to cheat, but it provides a much greater possibility that cheating will be observed and rectified.

Government corruption seems to be a function of government size.  A survey earlier this year found that “87% of voters nationwide believe corruption is widespread in the federal government. Solid majorities believe there is also corruption in state (70%) and local (57%) government.”  Looked at the other way round, only 13% of us believe the federal government is possibly honest, compared to 30% for states and 43% for localities.  I actually believe that one of the local governments to whom I pay taxes is pretty honest and efficient.

State and federal governments might logically collect some of the economic rent.  Examples currently include severance taxes and could reasonably include rents for electromagnetic spectrum should our rulers become persuaded to levy and collect them. Existing federal agencies are able to review and evaluate collection efforts.


In Japan, folks know that houses depreciate

image credit: insho impression CC BY-ND 2.0

According to this post, Japanese don’t expect the value of their houses to grow.  It seems that they routinely recognize the house and land as separate purchases, and after a few decades the house might have no value at all.  The inference is that land value also might not increase, but at least is unlikely to drop much. (Of course the same trends in value occur in the U S, but we tend not to recognize it.)

As a result, empty-nesters in Japan don’t count on funding their retirements by selling their houses.  As noted in the comments, this also means that housing in Japan is much more affordable than in North America.

Another post by the same writers observes that vacant land in Japan is subject to very high taxes — six times the rate for land with structures.  So landowners are reluctant to demolish worthless houses.  The result is over 13% of houses (as of 2013) were vacant, many of them deteriorated and uninhabitable.    (This article asserts that Japan had 8.5 million “abandoned homes” in 2018, but provides no source and doesn’t define “abandoned.”  This table from the Japan Statistics Bureau reports 8,764,400 vacant dwellings, 14% of Japan’s housing. Most are “for sale” or “for rent.” )

14% seems like a lot, but the equivalent U S rate is 12.2% (according to the press release here which might soon be memory-holed in favor of an update.)


What the Tribune missed

iTax Dodge protest
image from Michael Casey via flickr (cc)

Last year the remnant of the Chicago Tribune requested ideas for elements of a new “Plan of Chicago.” They even posted a few of the responses on their site. I suppose some were included in the hardcopy newspaper too.  But those don’t seem to have included my submission, so I probably ought to post it here.

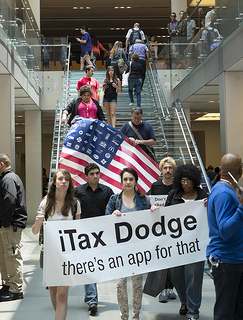
My proposal, of course, relates to how public revenue is raised.  The protesters pictured on the right probably wouldn’t realize that it relates to their concerns, and would almost certainly cause Apple to make a greater contribution to local coffers than they do now. But it wouldn’t increase any corporate tax rate nor prevent Apple from playing accounting games.  It doesn’t need to.

Here’s the proposal as submitted on October 24 2013: Continue reading What the Tribune missed