Tax favors for owners of “farmland”

Continuing our exploration of land values and real estate taxes in Cook County …
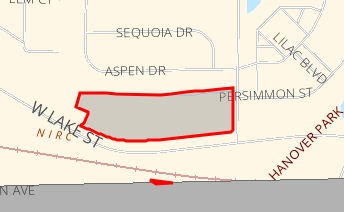
parcel #06364020270000, at 1830 Lake St in Hanover Park
Parcel #06364020270000,  at 1830 Lake St in Hanover Park. 7.36 acres, adjacent to a residential area and virtually across the street from a Metra station. Due to favors done for class 239 farmland owners, it pays less than $200/year in property tax.

The County contains 813 parcels coded as class 239 “non-equalized land under agricultural use, valued at farm pricing.”   An explanation of how farms are supposedly assessed is included in this document,  page 12 of which states:

The assessor notes each of the farm’s land use categories and uses the equalized assessed value for each soil productivity index to determine the assessed value. The assessor may make some subtractions for things like slope, drainage, ponding, flooding, and field shape and size before calculating the final value.
• The portion on which crops are planted is assessed at the state-certified equalized assessed value certified by the Department for the corresponding soil productivity index.
• Permanent pasture is assessed at one-third of what would be assigned if it was planted in crops.
• Other farmland (e.g., forestland, grass waterways) is assessed at one-sixth of what would be assigned if it was planted in crops.
• Wasteland has no assessed value unless it contributes to the productivity of the farm.

For Cook County, the Assessor provides specifics here.

The total assessed value of these 813 parcels is $2.25 million.  To calculate their acreage it seems I would have to retrieve the records manually and individually, but the 2022 Census of Agriculture says the County contains 154 farms totaling 10,281 acres.  (A farm might comprise several parcels).  This implies an assessed value of $218/acre. Reviewing a small sample of parcels, it appears that the Assessor values most class 239 parcels at $2250/acre, and assesses them at 10% of that, or $225/acre.

One might compare this to the Illinois Society of Farm Managers and Rural Appraisers’ report, which includes but doesn’t break out Cook County, and indicates sales prices in Northeastern Illinois range from $5500 to $40,000 per acre.

There’s no minimum parcel size for a “farm” under class 239.  Thus, we have a series of 18 small vacant lots in Matteson: 31-20-218-001-0000 thru 31-20-218-018-0000.  All of these appear to be empty lots, awaiting the construction of houses.   Eight of them are classified as vacant land, with assessed values ranging from $5392 to $7953 (differences apparently due to differing sizes).  Taxes due on these in 2024 range from $2351 to $3467 (excluding overdue taxes from the prior year, but including interest charged). But ten of these similar lots are class 239, farmland, assessed at $50 to $84. The County issues tax bills of zero for these parcels.  This is claimed to be due to 35 ILCS 200/18-40, which states

If the equalized assessed value of any property is less than $150 for an
assessment year, the county clerk may declare the imposition and collection of
all tax for that year to be extended on the parcel to be unfeasible and
cancelled. No tax shall be extended or collected on the parcel for that year
and the parcel shall not be sold for delinquent taxes.

However, these parcels are assessed at $50 to $84.  Applying the equalization factor of 3.0163 results in EAV  greater than $150. In response to my inquiry, the Cook County Treasurer explained that, even tho equalized assessed valuation is printed on the tax bill, it isn’t used for taxation of farm properties.  Here are the 18 parcels:
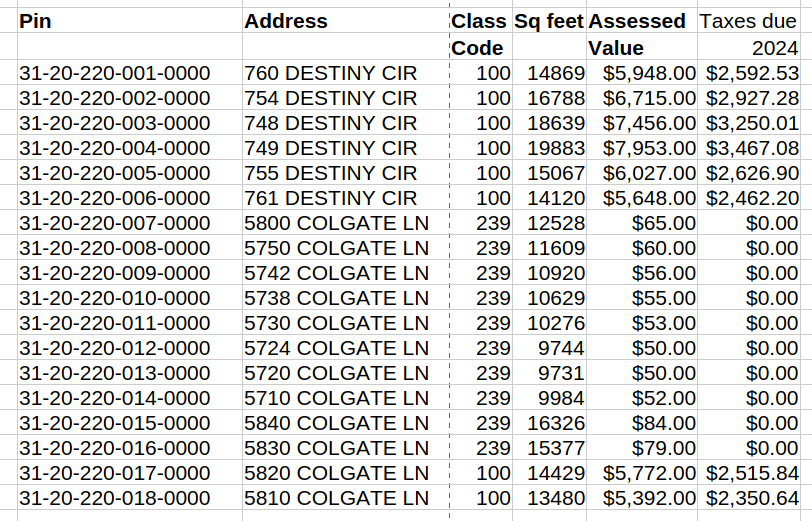
table of data
18 vacant lots in Matteson


I don’t know why 10 of these properties are assessed as farmland while 8 are not.

Countywide, the 813 class 239 parcels have a total assessed value of $2,251,552. While the Assessor’s records are imperfect (there being, for example, no “Dundee” municipality in Cook County), it appears that only 37 of the County’s municipalities (plus a few unincorporated areas) contain class 239 parcels.  The tally is shown in the following table.  Keep in mind that these are assessed value, 1/10th or less of the actual market value.
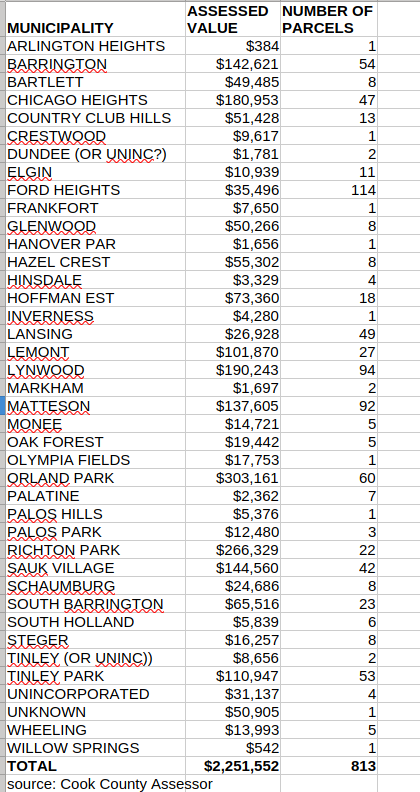
table showing class 239 parcels in Cook County
Summary of Class 239 parcels by place

While class 239 is a great bargain for owners of “farmland,” the inequity doesn’t seem, by itself, to have a major effect on the financial condition of the taxing bodies.  For example, Ford Heights has the largest number of class 239 parcels, 114.  Total class 239 assessed value in Ford Heights is $35,496.  If this land was subject to equalization like other parcels, the equalized assessed value would be $107,067.  As noted above, the Assessor seems to undervalue class 239 parcels, but even if we assume undervaluation of 75%, the total EAV of these parcels would be $428,268, for a net increase of at least $392,772.  (I say “at least”  because some or all of the class 239 parcels may be assessed at less than $150 and therefore completely untaxed.)  The latest report I can find for Ford Heights total EAV, from 2022, is $14,201,062.  Thus, if my assumptions are correct, and tax levies don’t change, then the typical property owner would save just 2.76%,   Longer-term, landowners might be encouraged to develop their parcels, with housing or other improvements, so the benefit over time might be greater and might not only be financial. There would be no expense to the Village or other taxing bodies.

And of course the captioned illustration at the top of this post, 7+ acres in desirable Hanover Park, easy walk to Metra, adjacent to residential areas (or suitable for retail/commercial use), takes advantage of class 239 to pay taxes of less than $200/year.

[Still more to come.]


To make black seem white and wrong seem right

Of course Henry George, writing in the 1890s, explained how sinister forces are able to manipulate the opinions of the public against our own interests. 

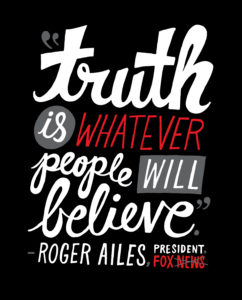
Truth is whatever people will believe
Credit: Chris Piascik
(CC BY-NC-ND 2.0)
The power of a special interest, though inimical to the general interest, so to influence common thought as to make fallacies pass as truths, is a great fact without which neither the political history of our own time and people nor that of other times and peoples can be understood. A comparatively small number of individuals brought into virtual though not necessarily formal agreement of thought and action by something that makes them individually wealthy without adding to the general wealth, may exert an influence out of all proportion to their numbers. A special interest of this kind is, to the general interests of society, as a standing army is to an unorganized mob. It gains intensity and energy in its specialization, and in the wealth it takes from the general stock finds power to mold opinion. Leisure and culture and the circumstances and conditions that command respect accompany wealth, and intellectual ability is attracted by it. On the other hand, those who suffer from the injustice that takes from the many to enrich the few, are in that very thing deprived of the leisure to think, and the opportunities, education and graces necessary to give their thought acceptable expression. They are necessarily the “unlettered,” the “ignorant,” the “vulgar,” prone in their consciousness of weakness to look up for leadership and guidance to those who have the advantages that the possession of wealth can give … This is of human nature. The world is so new to us when we first come into it; we are so compelled at every turn to rely upon what we are told rather than on what we ourselves can discover; what we find to be the common and respected opinion of others has with us such almost irresistible weight, that it becomes possible for a special interest by usurping the teaching province to make to us black seem white and wrong seem right. … [W]e  have but to look around us to discover in operation today the great agency that has made falsehood seem truth.

Henry George
Science of Political Economy
Book II Chapter 2
source

Any questions?

Cheap housing is on cheaper land

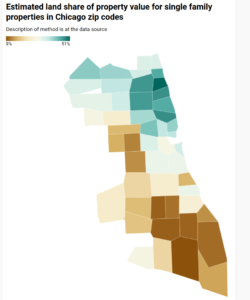
Click for larger, interactive map

UPDATE Aug 29 2021:  If anyone familiar with Chicago doubts that removing improvements from the tax base will ease the burden on low-income homeowners, this map will be instructive.   The original, mapless post from Aug 25 follows.

We sometimes are told that a land value tax (LVT) would punish the poor person who has a small rundown house on a high-value lot, while benefiting the person next door who has a large fancy house on an identical lot. And that’s not wrong, it’s just atypical.  In practice, we believe, poor people mostly live in neighborhoods where housing is cheap and land is cheaper, thus they would tend to benefit from a shift to LVT.

As the quality of Cook County assessments has been improving, we expect to be able to show this by analysis of that data. In the meantime, we have some estimates of land and improvement value from William Larson and colleagues at the Federal Housing Finance Agency.  Using appraisals produced for mortgage underwriting, they estimate land and improvement values for homes in most zip codes (and census tracts) nationwide.  Their source data includes only single family properties which were appraised for mortgage purposes.  They consider only parcels where the improvement is less than 15 years old, and exclude vacant land as well as land where the appraised value is very close to the assessed value (in case appraisers might have relied on low-quality or obsolete assessments).  Also excluded are zip codes with an insufficient number of single family home transactions.

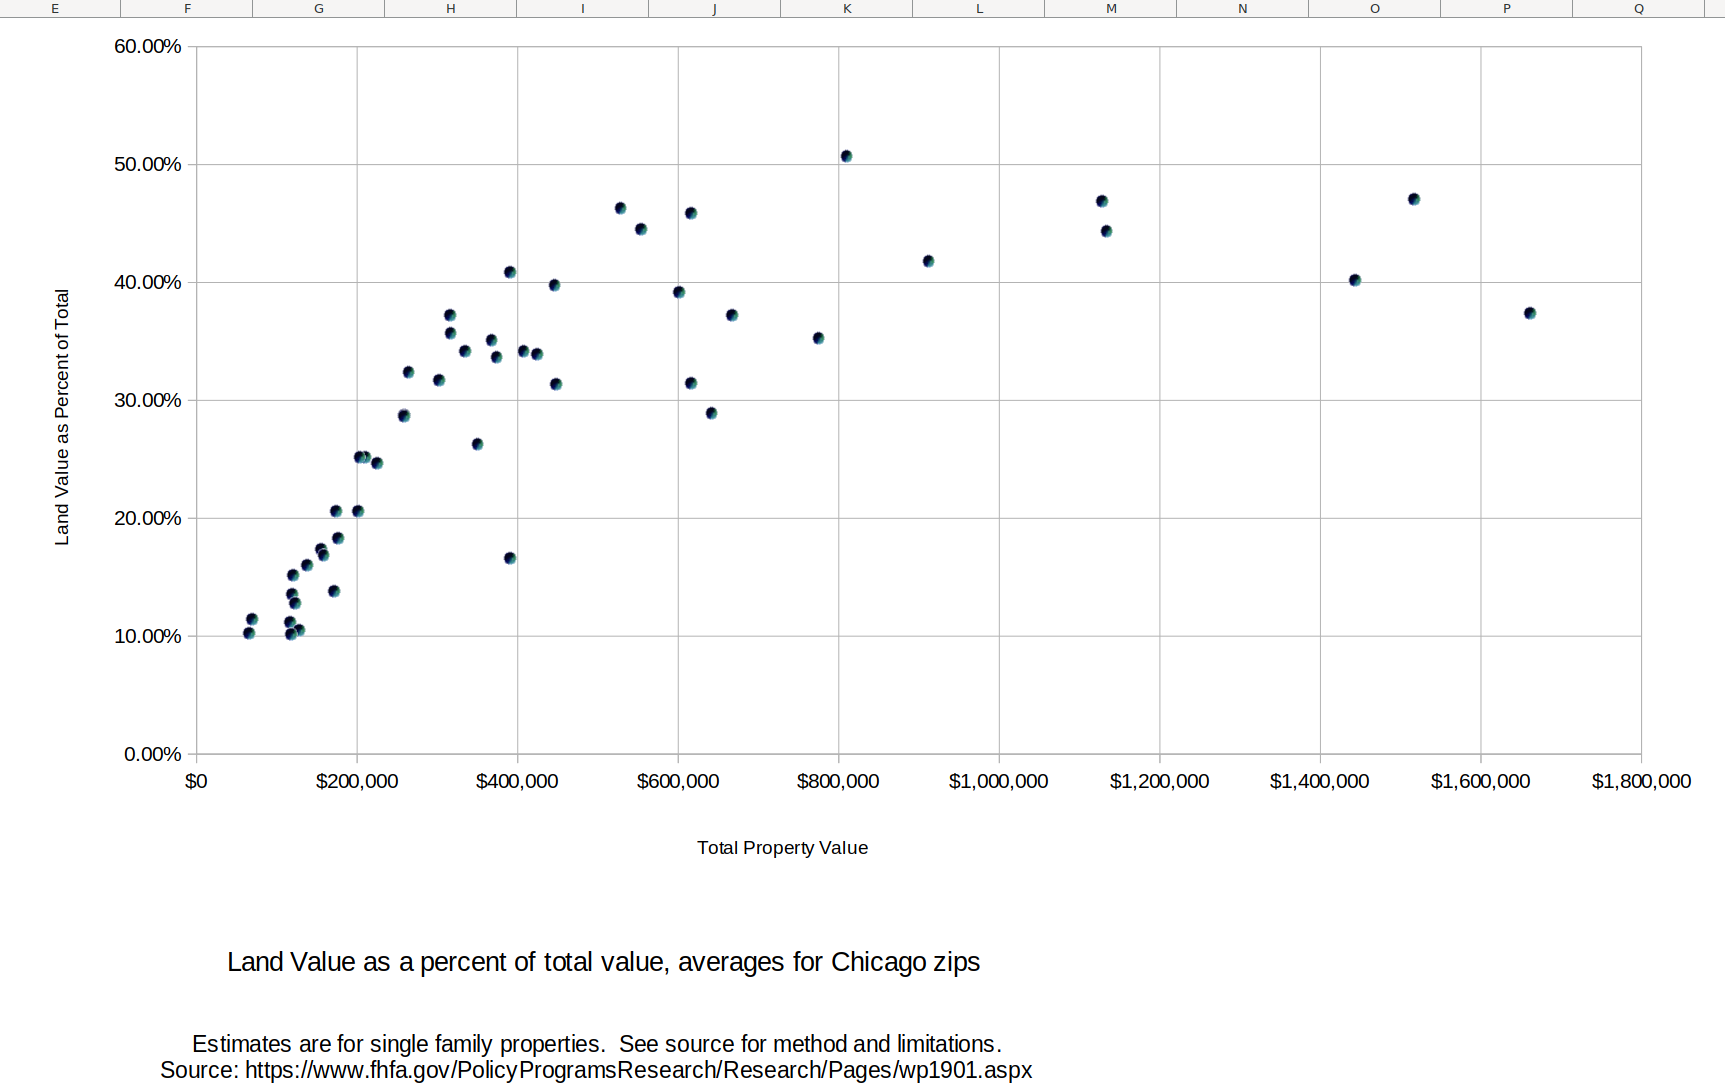
The chart below shows, for Chicago zip codes, the ratio of land value to total value (vertical axis) and total value of the property (horizontal axis. What stands out is that the ratio tends to be lower where the properties are cheaper.  That is, a revenue-neutral shift of property taxation to land values only, ignoring value of improvements, would tend to reduce the taxes on low-value zip codes, while increasing it in higher-value areas.


The table below shows the data for each zip code, sorted from high proportion of value in land to low.   Clearly the more affluent areas have lower proportion of improvement value, and the areas with low income population have a higher proportion of improvement value.

Estimated land value proportion and related data for single family properties in Chicago zip codes
ZIP Code Lot Size building sq ft floor area ratio Property Value (As-is) Land Share of Property Value
60640 4300 2320 0.540 $809,500 50.70%
60614 2920 2950 1.010 $1,516,300 47.10%
60613 3740 2590 0.693 $1,128,200 46.90%
60625 4220 1860 0.441 $528,000 46.30%
60618 3580 1890 0.528 $615,800 45.90%
60660 3820 1940 0.508 $553,500 44.50%
60657 3210 2600 0.810 $1,133,300 44.40%
60622 3120 2330 0.747 $911,800 41.80%
60631 5620 1690 0.301 $390,700 40.90%
60610 2250 2900 1.289 $1,443,300 40.20%
60646 5370 1820 0.339 $445,900 39.80%
60647 3250 1880 0.578 $600,800 39.20%
60654 1990 3580 1.799 $1,661,200 37.40%
60630 4310 1550 0.360 $315,500 37.20%
60642 2230 2140 0.960 $667,200 37.20%
60641 4230 1640 0.388 $316,400 35.70%
60605 1840 2200 1.196 $774,700 35.30%
60659 4310 1800 0.418 $367,500 35.10%
60626 5410 2050 0.379 $407,400 34.20%
60656 5100 1500 0.294 $334,600 34.20%
60612 2910 1920 0.660 $424,300 33.90%
60645 4420 1870 0.423 $373,600 33.70%
60634 4240 1470 0.347 $264,100 32.40%
60608 2960 1530 0.517 $302,200 31.70%
60615 4460 2630 0.590 $615,700 31.50%
60616 2570 1950 0.759 $447,900 31.40%
60607 1970 2140 1.086 $641,400 28.90%
60655 5140 1490 0.290 $258,000 28.80%
60707 4940 1600 0.324 $258,700 28.70%
60637 3920 1970 0.503 $350,000 26.30%
60609 3320 1450 0.437 $209,700 25.20%
60639 3900 1420 0.364 $202,900 25.20%
60638 4280 1340 0.313 $225,100 24.70%
60632 3860 1300 0.337 $173,600 20.60%
60643 5960 1600 0.268 $200,800 20.60%
60652 4730 1330 0.281 $176,400 18.30%
60629 4040 1340 0.332 $155,300 17.40%
60651 3920 1440 0.367 $158,300 16.90%
60653 3290 2360 0.717 $390,100 16.60%
60644 4580 1650 0.360 $137,400 16.00%
60633 4690 1320 0.281 $120,200 15.20%
60649 4960 1870 0.377 $170,800 13.80%
60623 3510 1340 0.382 $118,500 13.60%
60624 3300 1540 0.467 $122,200 12.80%
60621 3880 1490 0.384 $69,300 11.50%
60617 4200 1360 0.324 $116,300 11.20%
60619 4320 1430 0.331 $127,700 10.50%
60636 3540 1270 0.359 $65,200 10.30%
60620 4180 1410 0.337 $117,800 10.20%
60628 4320 1340 0.310 $99,800 9.20%
source: https://www.fhfa.gov/PolicyProgramsResearch/Research/Pages/wp1901.aspx

A Chicago zip code map is here.

Also of interest, even tho the low-value areas have a high ratio of improvement to land value, this isn’t because of large houses on small lots.  The floor area ratio is generally lower in the areas with lower land value proportion.

Overall, the above data is consistent with Georgists’ assertion that low-income residents usually benefit from a switch to LVT.  I might be taking a further look at this dataset.

There is no mystery…

Ships Abandoned in Yerba Buena Cove San Francisco during the California Gold Rush 1849 (public domain image from Wikimedia)

…as to the cause which so suddenly and so largely raised wages in California in 1849, and in Australia in 1852. It was the discovery of the placer mines in unappropriated land to which labor was free that raised the wages of cooks in San Francisco restaurants to $500 a month, and left ships to rot in the harbor without officers or crew until their owners would consent to pay rates that in any other part of the globe seemed fabulous.

                              …Henry George; Progress & Poverty Book V Chapter 2

George goes on to describe how gold mining was organized, and why it was the form of tenure rather than just the availability of gold that raised wages:

[I]t was by common consent declared that this gold-bearing land should remain common property, of which no one might take more than he could reasonably use, or hold for a longer time than he continued to use it. This perception of natural justice was acquiesced in by the General Government and the Courts, and while placer mining remained of importance, no attempt was made to overrule this reversion to primitive ideas. The title to the land remained in the government, and no individual could acquire more than a possessory claim. The miners in each district fixed the amount of ground an individual could take and the amount of work that must be done to constitute use. If this work were not done, any one could relocate the ground. Thus, no one was allowed to forestall or to lock up natural resources. Labor was acknowledged as the creator of wealth, was given a free field, and secured in its reward.

— Progress & Poverty, Book V, Chapter 2

And now I tripped over a 2002 paper (From Commons to Claims: Property Rights in the California Gold Rush by Andrea G McDowell) that provides a lot of detail and background supporting George’s assertion. A particular mining claim might be 100 to 900 square feet. A miner would work it for a few weeks, then expect to move on to another one.  Thus the first miners to arrive had an incentive to avoid land monopoly, because they’d be looking for land again in a short while. “[The miners’] position can be summed up as a rejection of a fee-simple interest in mining claims on the grounds that this would result in the monopoly of the diggings by capitalists and the exclusion of individual miners from the chance to strike it rich.”

There’s a lot about how various mining districts managed their operations — certainly not all the same and often poorly documented, with a lot of the information coming from personal journals and correspondence rather than official sources.


Not the first daylight robbery, but a good one

I’ve long considered Dominic Frisby, perhaps the only working comic who’s also a financial writer, to be a Georgist.  Several years ago he posted a nice video explaining the land value tax.  Now he’s gone deep into a history of taxation and its effects, in  Daylight Robbery: How Tax Shaped Our Past and Will Change Our Future   Readable and succinct, but somehow by the end Frisby has forgot about his video.

The title is appropriate, so good that over a dozen older books already carry it, but the subtitle may be unique.  Frisby asserts quite a few facts new to me, and for the most part provides references (altho some are a bit summary, showing only the domain name such as cbs.com, or time.com, where one might need to search around a bit).

The book starts with the story of Hong Kong, a British colony which prospered thru free markets and lower taxes (The point stands, even tho in recent years external demand pushed housing costs to obscene levels, and in recent months political and governmental interference made conditions even more difficult.) Going thru tax history, Frisby of course discusses the effects of the window tax (“daylight robbery”), and explains why it was considered to be fairer and easier to administer than its predecessor. He tells us about tax revolts and England’s first income tax, all records of which were apparently destroyed (source citation is a two-volume history that I can find only in Latin).  He explains the cause of the U S War between the States (which Lincoln waged more for revenue purposes than in any opposition to slavery.)  He notes that Hitler was tax-exempt, and the Guardian used a Cayman Islands entity to (apparently legally) avoid taxes.

After lots more stories about taxation and its role in history, moving to modern times, Frisby explains (as if any of us need to know) the burden that taxation of productive activity places on people trying to, well, be productive. He talks about the digital nomads and crypto currencies which make collection of production tax more difficult, and about digital transactions which make the collection easier.

Finally he proposes a Utopian tax system.  Is it collection of all economic rent as the sole source of public revenue?  Not really.  He wants VAT (not to exceed 15%, and including narcotics) and income tax (also not to exceed 15%).  So the record-keeping burdens and complexities of those will remain, tho perhaps a bit reduced because the impact of error is less.  To these he wants to add L U T (Location Usage Tax), which is basically LVT but with perhaps a clearer name, and which would be set at some percentage of the land rental value.  He wants voters to choose the percentage, apparently a single rate nationwide. And since he aims to keep governmental expenditures below 15% of GDP, it’s unclear that there would be any L U T at all.

“The location usage tax does not apply just to land, but to any asset granted by nature — the airspace the mineral wealth, and even the broadcast spectrums.”  He doesn’t seem to have any problem with private collection of rent for “intellectual property,” even tho I P is a privilege granted and protected by the government, thus straightforward to track and assess– if there’s any justification for I P at all.

It seems that much of the land in Britain is “unregistered,” in that the owner isn’t known, and in Utopia this will be remedied by identifying every  owner.  I’m not sure why that’s necessary.  A tax bill could be posted for each parcel, and a copy mailed to the owner should s/he request it.  After due and repeated notice, If the bill isn’t paid, the land could be taken over by the Crown (or whatever they call it over there), and auctioned to somebody willing to pay the tax. (If nobody’s willing to pay the tax, it needs to be reduced.)

Would I like to live in Frisby’s Utopia? Well, of course here in the U S we have no VAT, and the retail sales tax is generally less than 15%. But income tax can be higher, and we have various other taxes which Frisby proposes to eliminate.  And LVT has other benefits in addition to the revenue it generates.  So on the whole, it’s a better deal, a step in the right direction. But Utopia? Go back and watch the video.

(Note: This review is of the 2019 edition of the book.  The Publisher’s web site indicates that a new edition will be released later in 2020.)

High land prices as a banking problem

image credit: Ann Priestley (cc) via flickr

Here’s an (audio) interview with economist Richard Werner, who remarks on the problems high land prices have posed for the Japanese economy in recent decades, and the relevance for the U S and other nations.  Dropping interest rates supports higher land prices, as well as facilitating financial engineering, but does little for actual investment in the real economy.  Small businesses, who actually provide useful goods or services, still have trouble borrowing because big banks don’t want to deal with them. The number of small “community” banks, more likely to actually meet the needs of small businesses,  in the U S has been declining.  He suggests that having more local banks, especially co-operative banks, would be an effective way to make loans available.   This seems plausible, as ILSR says that “In 2018, community-based financial institutions made 52 percent of all small business loans, even though they controlled only 16 percent of banking assets.”  Yet it seems there’s no shortage of local banks, as least in medium and larger cities.

In this interview he never mentions the possibility of a substantial land value tax as a way to curb land speculation.  As Keizo Takagi wrote in 1989, Japan’s land value tax “has been so low that [it] has not functioned properly as a holding cost,” [p. 129] thus failing to control speculative prices.

Perhaps deliberately or perhaps ignorantly, the Bloomberg interviewers didn’t bother to bring this up in the interview. Werner’s conclusion seems to be that, rather than ZIRP, interest rates should be allowed to rise to a level where local banks could more easily find loans profitable.  I suppose that might be better than nothing.


Putting government pension costs into perspective

Wirepoints recently issued a helpful report showing state and local government pension debt per Chicago household.  They estimate the burden at $144,000 per household.  This is a big number, but one could suppose that a prosperous household, over decades, could bear such a burden.  Some could, but probably not those below poverty level.  Take them out of the picture and the per household amount rises to $172,000.  Excluding households with incomes below $75,000, or below $200,000, and the per-household amount rises further, to $393,000 and $2,022,000 respectively.

Here’s their chart: pension debt chart

Of course this doesn’t consider land values, nor businesses.  If prime Chicago land is worth $1,000/sq ft, that’s 5.38 sq miles.  But more typical land value is much less, probably no more than $25/sq ft. (it seems that nobody has tried to estimate citywide values). That would be 112 square miles.  Once we subtract land owned by governments, churches and other exempt nonprofits, we might be approaching the total value of all land in Chicago. And that’s just for pensions, not bonded debt, nor needed capital improvements.  Real estate buyers know, or certainly should know, about these encumbrances.

Of course money can be raised from business taxes, but that’s hardly a way to grow economic opportunity for Chicagoans. I would consider any tax revenue from “gaming” as a kind of business tax.

The lesson Wirepoints draws from this is that pensions have to be downsized somehow, which required amending the state constitution.  And they go further, comparing government salaries to those of the private sector:

some local gov't salaries compared to average workers

So it looks like we’re going to have to confront a large number of people with guns and firehoses and control over our children, who have been getting a lot of money from us for years and may prefer not to moderate their demands.

Tho I don’t know how, this problem will be solved. Maybe MMT will yield a continuing stream of funds to bail us out.  Maybe inflation will accelerate such that the fixed 3% compounded pension increase isn’t a burden.  Maybe Chicagoans will decide that they just don’t want so many government “services.”  Maybe politicians will decide to remove all taxes from productive economic activity, taxing only the value of land and other privileges (such as the private monopoly over street parking fees), which will grow the economy (while reducing the need for emergency services) sufficient to make pensions a non-issue.

And when it is solved, those who own land and other privileges will benefit most.

“Chicago’s growth spurt” part of expanding Gaffney trove

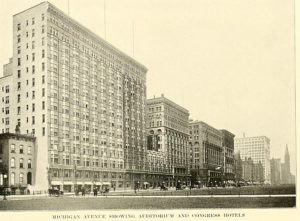
Michigan Avenue around 1912.

As Polly Cleveland continues her project posting Mason Gaffney’s works, we find “Chicago’s Growth Spurt, 1890-1900.”  It’s not very long, and worth reading today as a contrast to our current stagnation. Most importantly, Gaffney deduces circumstantial evidence that during the era of growth, land values were significantly taxed.  As he notes in conclusion, “More research into Chicago’s political history is needed.”

The whole trove contains dozens of working papers, class notes, and publications, in Gaffney’s concise and understandable style.  (You’ll find it linked here as well as above; depending on your screen size and magnification you might need to scroll over to the right to see it.)


Ideas from Jeff Smith

Jeff Smith has provided some interesting ideas for achieving geoist progress, and enumerated a bunch of them in a February 15 2018 email to many geoists with subject line “Re: LT: Re: Trump Infrastructure Plan Calls for Value Capture Financing“.  Previously and subsequently, Jeff has suggested that geoists should act in accordance therewith. Possibly because of the subject line, or the nature of internet discussions, some of us may have forgotten or never seen this message. Jeff’s text is reproduced below:

Never forget reading is part of the problem. Doing is part of the solution.
 
The fact that I’m the only Georgist with the curiosity to research what’s known about social change is a very telling fact. I should not be your gatekeeper to this world of fascinating information. Every or at least dozens of
 
people with the dream of changing society should want to know how society changes!
 
To not want to know is a constant reminder that I’m a member of a mad species — just like most people don’t want to know how to make economies work right.
 
Here are some efforts of others who know paradigm shifts follow principles:
 
Kuhn is the classic. “Old minds don’t change; they just die out, replaced by young open ones.” So appeal to the young. Learn to dance, you stiff fuddy-duddies. Our problem: Georgist elders attract youth exactly like themselves—conservative, conformist, obedient, not your classic profile for agents of change. https://www.ted.com/talks/derek_sivers_how_to_start_a_movement
 
More recently, Reich’s 4 buttons: Rot at top, Barbarians at gate, Self-made, Group identity. Even though by a Dem (Clinton’s Labor Sec), only Trump was savvy enough to use them, unlike us and other ideologues: http://changingminds.org/disciplines/storytelling/plots/reich_narrative.htm
 
Lakoff, one of my grad school contemporaries, is also ignored for urging do-gooders to learn how to frame: “Frame yourselves before others frame you.” You framed yourself as a taker (taxist), not a sharer, like basic income, which has far more innate appeal: https://medium.com/indivisible/george-lakoff-on-indivisible-36931ee03c5
 
Use unique language, like “geonomics” not boring code like “LVT”: https://www.bustle.com/p/9-genius-ways-to-change-someones-mind-according-to-science-2307178
World Bank: To measure progress, count (John Berger made the same point):  http://blogs.worldbank.org/voices/5-tips-on-starting-a-social-movement
 
Develop empathy, lose British classism and academic snobbery: “Strong beliefs, loosely held.”  https://heleo.com/facts-dont-change-peoples-minds-heres/16242/
 
Harvard: Engagement, not rhetoric—interact with real people on their terms:  https://hbr.org/2016/11/what-successful-movements-have-in-common
Leadership—suggestions for everyone, even non-alpha rats: http://nclp.umd.edu/resources/social_change_model
Source of millions of volunteers, an enormously valuable resource for Georgists to ignore: https://www.dosomething.org
 
 
But don’t limit yourself. Google. Yet balance mere reading with actual doing.
 
I have my own that worked to start several cutting-edge groups: How to Make a Movement in 5 Easy Steps:
1 Message
2 Members, including celebs
3 Money
4 Media, including star power
5 Maintenance—every other meeting should be a party. Seriously.
6 aMass the Multitudes—demonstrate—and Meet the Minions of the Moguls—i.e., lobby.
7 Make Merry your victory
 
Georgists fail at Step 1, so they can’t get out the gate. They must redo Step 1 and translate their message into the language of their intended audience. To know what to say, they’d have to use focus groups, polls, and surveys. But that’s too rational for ideologues, so far.
 
“We cannot become what we need to be by remaining what we are.”
 
You can’t reform by conforming. You just lose the respect of both reformers and conformists.
 
If there is a mistake to be made in shifting paradigms, Georgists have made all of them.
 
Thanks, Fred, the opportunity to feel nostalgic for old, ignored, powerful ideas. You did not offer to quit doing what does not work and devote that time to doing what does work. Hence, most likely, you asked me to waste my time. 
 
“The dog barks but the caravan moves on.” Into the desert.
 
I should stop barking now.

Jeffery J. Smith
Author, Perfect Timing. 503/568-5889
Co-founder, principal, DocTours. 707/355-3002
https://www.medicaldentaltourism.net

Notes on farmland from the 2017 Census of Agriculture for Illinois

wind turbines in a farm field
1009 Illinois farms have leased wind rights to others. (“Farms” by jopaha is licensed under CC BY-ND 2.0 )

The 2017 Census of Agriculture Illinois report was issued earlier this month, and here are a few statistics of interest:

Total value of land and buildings for the 72,651 farms in the state was $196,542,978,000. This amounts to $2.7 million per farm, and $7,278 per acre. Real estate taxes paid were $431,625,000, implying an effective tax rate of 0.22%.

58% of the acreage is tenant-farmed.  However most (44,378) of the farms are owned by the operator, whereas 6,021 are farmed by tenants.  The remainder (22,252) combine owned and rented acreage. The rent may be cash, or a share of crop, or other arrangement. Cash rent was reported to total $1,956,402,000.

Remember that whereas Georgists are concerned about who receives land rent:

  • The above figures may be mostly land, but do include buildings
  •  Even farmland may have some improvements, for example drainage tiles, and the value added by these is not “land” for purposes of political economy.

Illinois contains 7,992 very small farms of 1-9 acres (Anything smaller than 1 acre isn’t counted in this census,)  Most have less than $2500 revenue, but 64 of them report $1,000,000 or more.  3122 are operated by people who say farming is their primary occupation.

The report contains a huge amount of detailed information gathered from farm operators.  That may help explain why the actual response rate (nationally) was just 71.8%, with systematic estimates covering the remainder. This rate is down from 74.6% in 2012, and 78.2% in 2007.  Much of the data is reported at the county level as well as statewide.