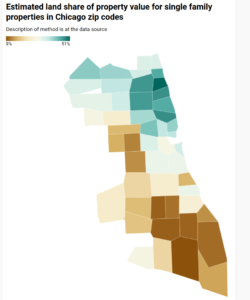
Cheap housing is on cheaper land

Click for larger, interactive map

UPDATE Aug 29 2021:  If anyone familiar with Chicago doubts that removing improvements from the tax base will ease the burden on low-income homeowners, this map will be instructive.   The original, mapless post from Aug 25 follows.

We sometimes are told that a land value tax (LVT) would punish the poor person who has a small rundown house on a high-value lot, while benefiting the person next door who has a large fancy house on an identical lot. And that’s not wrong, it’s just atypical.  In practice, we believe, poor people mostly live in neighborhoods where housing is cheap and land is cheaper, thus they would tend to benefit from a shift to LVT.

As the quality of Cook County assessments has been improving, we expect to be able to show this by analysis of that data. In the meantime, we have some estimates of land and improvement value from William Larson and colleagues at the Federal Housing Finance Agency.  Using appraisals produced for mortgage underwriting, they estimate land and improvement values for homes in most zip codes (and census tracts) nationwide.  Their source data includes only single family properties which were appraised for mortgage purposes.  They consider only parcels where the improvement is less than 15 years old, and exclude vacant land as well as land where the appraised value is very close to the assessed value (in case appraisers might have relied on low-quality or obsolete assessments).  Also excluded are zip codes with an insufficient number of single family home transactions.

The chart below shows, for Chicago zip codes, the ratio of land value to total value (vertical axis) and total value of the property (horizontal axis. What stands out is that the ratio tends to be lower where the properties are cheaper.  That is, a revenue-neutral shift of property taxation to land values only, ignoring value of improvements, would tend to reduce the taxes on low-value zip codes, while increasing it in higher-value areas.
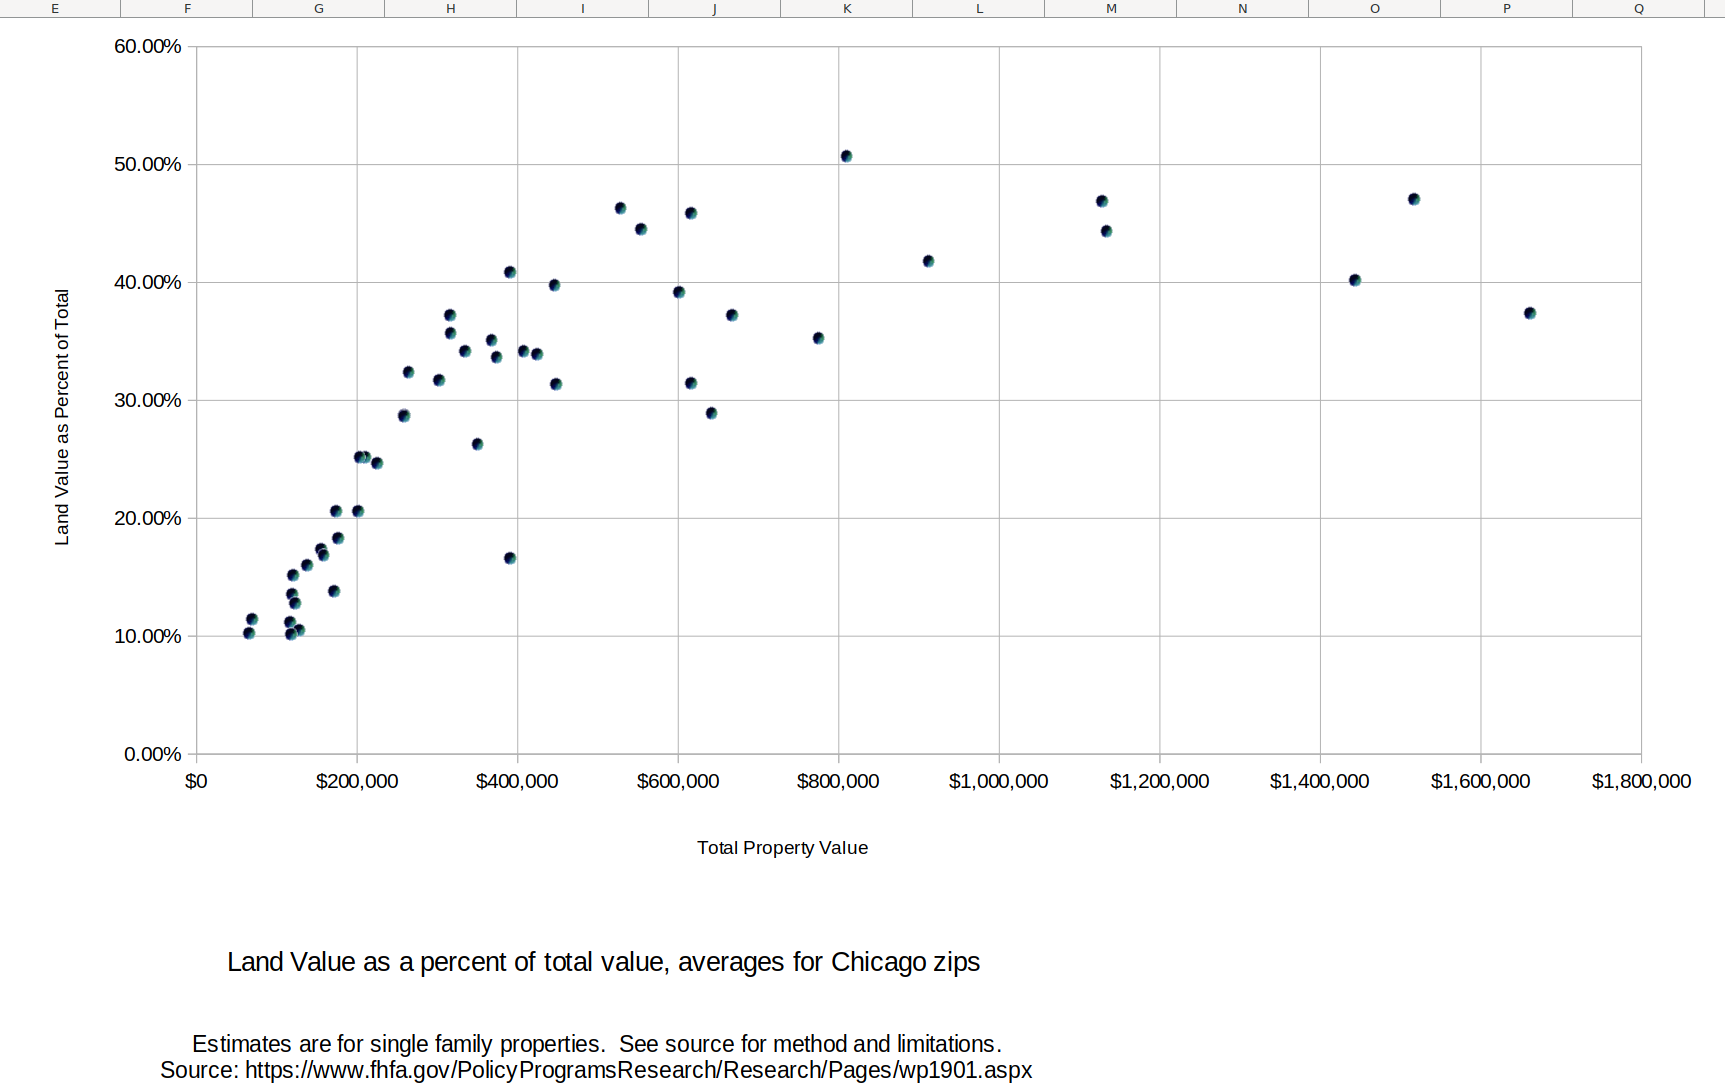
 

The table below shows the data for each zip code, sorted from high proportion of value in land to low.   Clearly the more affluent areas have lower proportion of improvement value, and the areas with low income population have a higher proportion of improvement value.

Estimated land value proportion and related data for single family properties in Chicago zip codes
ZIP Code Lot Size building sq ft floor area ratio Property Value (As-is) Land Share of Property Value
60640 4300 2320 0.540 $809,500 50.70%
60614 2920 2950 1.010 $1,516,300 47.10%
60613 3740 2590 0.693 $1,128,200 46.90%
60625 4220 1860 0.441 $528,000 46.30%
60618 3580 1890 0.528 $615,800 45.90%
60660 3820 1940 0.508 $553,500 44.50%
60657 3210 2600 0.810 $1,133,300 44.40%
60622 3120 2330 0.747 $911,800 41.80%
60631 5620 1690 0.301 $390,700 40.90%
60610 2250 2900 1.289 $1,443,300 40.20%
60646 5370 1820 0.339 $445,900 39.80%
60647 3250 1880 0.578 $600,800 39.20%
60654 1990 3580 1.799 $1,661,200 37.40%
60630 4310 1550 0.360 $315,500 37.20%
60642 2230 2140 0.960 $667,200 37.20%
60641 4230 1640 0.388 $316,400 35.70%
60605 1840 2200 1.196 $774,700 35.30%
60659 4310 1800 0.418 $367,500 35.10%
60626 5410 2050 0.379 $407,400 34.20%
60656 5100 1500 0.294 $334,600 34.20%
60612 2910 1920 0.660 $424,300 33.90%
60645 4420 1870 0.423 $373,600 33.70%
60634 4240 1470 0.347 $264,100 32.40%
60608 2960 1530 0.517 $302,200 31.70%
60615 4460 2630 0.590 $615,700 31.50%
60616 2570 1950 0.759 $447,900 31.40%
60607 1970 2140 1.086 $641,400 28.90%
60655 5140 1490 0.290 $258,000 28.80%
60707 4940 1600 0.324 $258,700 28.70%
60637 3920 1970 0.503 $350,000 26.30%
60609 3320 1450 0.437 $209,700 25.20%
60639 3900 1420 0.364 $202,900 25.20%
60638 4280 1340 0.313 $225,100 24.70%
60632 3860 1300 0.337 $173,600 20.60%
60643 5960 1600 0.268 $200,800 20.60%
60652 4730 1330 0.281 $176,400 18.30%
60629 4040 1340 0.332 $155,300 17.40%
60651 3920 1440 0.367 $158,300 16.90%
60653 3290 2360 0.717 $390,100 16.60%
60644 4580 1650 0.360 $137,400 16.00%
60633 4690 1320 0.281 $120,200 15.20%
60649 4960 1870 0.377 $170,800 13.80%
60623 3510 1340 0.382 $118,500 13.60%
60624 3300 1540 0.467 $122,200 12.80%
60621 3880 1490 0.384 $69,300 11.50%
60617 4200 1360 0.324 $116,300 11.20%
60619 4320 1430 0.331 $127,700 10.50%
60636 3540 1270 0.359 $65,200 10.30%
60620 4180 1410 0.337 $117,800 10.20%
60628 4320 1340 0.310 $99,800 9.20%
source: https://www.fhfa.gov/PolicyProgramsResearch/Research/Pages/wp1901.aspx

A Chicago zip code map is here.

Also of interest, even tho the low-value areas have a high ratio of improvement to land value, this isn’t because of large houses on small lots.  The floor area ratio is generally lower in the areas with lower land value proportion.

Overall, the above data is consistent with Georgists’ assertion that low-income residents usually benefit from a switch to LVT.  I might be taking a further look at this dataset.

Putting government pension costs into perspective

Wirepoints recently issued a helpful report showing state and local government pension debt per Chicago household.  They estimate the burden at $144,000 per household.  This is a big number, but one could suppose that a prosperous household, over decades, could bear such a burden.  Some could, but probably not those below poverty level.  Take them out of the picture and the per household amount rises to $172,000.  Excluding households with incomes below $75,000, or below $200,000, and the per-household amount rises further, to $393,000 and $2,022,000 respectively.

Here’s their chart: pension debt chart

Of course this doesn’t consider land values, nor businesses.  If prime Chicago land is worth $1,000/sq ft, that’s 5.38 sq miles.  But more typical land value is much less, probably no more than $25/sq ft. (it seems that nobody has tried to estimate citywide values). That would be 112 square miles.  Once we subtract land owned by governments, churches and other exempt nonprofits, we might be approaching the total value of all land in Chicago. And that’s just for pensions, not bonded debt, nor needed capital improvements.  Real estate buyers know, or certainly should know, about these encumbrances.

Of course money can be raised from business taxes, but that’s hardly a way to grow economic opportunity for Chicagoans. I would consider any tax revenue from “gaming” as a kind of business tax.

The lesson Wirepoints draws from this is that pensions have to be downsized somehow, which required amending the state constitution.  And they go further, comparing government salaries to those of the private sector:

some local gov't salaries compared to average workers

So it looks like we’re going to have to confront a large number of people with guns and firehoses and control over our children, who have been getting a lot of money from us for years and may prefer not to moderate their demands.

Tho I don’t know how, this problem will be solved. Maybe MMT will yield a continuing stream of funds to bail us out.  Maybe inflation will accelerate such that the fixed 3% compounded pension increase isn’t a burden.  Maybe Chicagoans will decide that they just don’t want so many government “services.”  Maybe politicians will decide to remove all taxes from productive economic activity, taxing only the value of land and other privileges (such as the private monopoly over street parking fees), which will grow the economy (while reducing the need for emergency services) sufficient to make pensions a non-issue.

And when it is solved, those who own land and other privileges will benefit most.

“Chicago’s growth spurt” part of expanding Gaffney trove

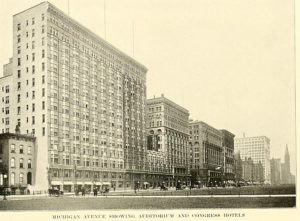
Michigan Avenue around 1912.

As Polly Cleveland continues her project posting Mason Gaffney’s works, we find “Chicago’s Growth Spurt, 1890-1900.”  It’s not very long, and worth reading today as a contrast to our current stagnation. Most importantly, Gaffney deduces circumstantial evidence that during the era of growth, land values were significantly taxed.  As he notes in conclusion, “More research into Chicago’s political history is needed.”

The whole trove contains dozens of working papers, class notes, and publications, in Gaffney’s concise and understandable style.  (You’ll find it linked here as well as above; depending on your screen size and magnification you might need to scroll over to the right to see it.)


Notes on farmland from the 2017 Census of Agriculture for Illinois

wind turbines in a farm field
1009 Illinois farms have leased wind rights to others. (“Farms” by jopaha is licensed under CC BY-ND 2.0 )

The 2017 Census of Agriculture Illinois report was issued earlier this month, and here are a few statistics of interest:

Total value of land and buildings for the 72,651 farms in the state was $196,542,978,000. This amounts to $2.7 million per farm, and $7,278 per acre. Real estate taxes paid were $431,625,000, implying an effective tax rate of 0.22%.

58% of the acreage is tenant-farmed.  However most (44,378) of the farms are owned by the operator, whereas 6,021 are farmed by tenants.  The remainder (22,252) combine owned and rented acreage. The rent may be cash, or a share of crop, or other arrangement. Cash rent was reported to total $1,956,402,000.

Remember that whereas Georgists are concerned about who receives land rent:

  • The above figures may be mostly land, but do include buildings
  •  Even farmland may have some improvements, for example drainage tiles, and the value added by these is not “land” for purposes of political economy.

Illinois contains 7,992 very small farms of 1-9 acres (Anything smaller than 1 acre isn’t counted in this census,)  Most have less than $2500 revenue, but 64 of them report $1,000,000 or more.  3122 are operated by people who say farming is their primary occupation.

The report contains a huge amount of detailed information gathered from farm operators.  That may help explain why the actual response rate (nationally) was just 71.8%, with systematic estimates covering the remainder. This rate is down from 74.6% in 2012, and 78.2% in 2007.  Much of the data is reported at the county level as well as statewide.


More stuff that’s still true about location and “intellectual” “property”


Photo by Jimmy Emerson, DVM, (cc) via flickr

Anyone reading this blog might get bored with the number of times I say that Henry George was right, and is even more right today than in his own time.  But that’s what I do, and part of the reason for this blog is to provide a place where I can record show up.

Location is [still] everything, says the new book by Prof David R. Bell.  When I saw the title, I thought it was about land value and real estate, but no, it’s actually about marketing on the Internet and evidence that location matters, a lot, to marketers working in that [virtual] space.  For example, the best initial customers for your Internet business might be those who are relatively isolated and haven’t any local sources for your product.  Subsequent customers might be those nearby to these customers, who learn of you thru conversation or by observing distinctive shipping boxes.  And, for some reason which Bell does not try to explain, even for virtual goods people are most likely to turn to the geographically closest sources.

It’s a nice book for anyone who studied economic geography and marketing in the dark ages, bringing a few things up to date, but quite accessible to every interested reader.

Then there’s the matter of monopoly over text, part of what’s sometimes called “intellectual property” by those who seek to profit by restricting it. This comes from a fascinating interview with writer Poe Ballantine, well worth a listen in its entirely.  Ballantine has found it difficult making a living as a writer, drifting geographically and among relatively menial jobs, mainly in food service it seems. He says that after four books he was still known mainly as “the cook.” But now he has reached the point where he can actually earn a living as a writer.

[starting about 45:35 into the audio]

Q: So your writing is sustaining you financially?

A: The writing is not quite enough, but the appearances, the invitations from colleges and universities are what cover my expenses right now. They pay very well. That’s where the money is; the money is not in selling books, the money is in the universities where people go to get their writing degrees.

So maybe the fighting over copyrights doesn’t benefit the writer? But, at least, sometimes the education monopoly brings about something useful.


Low wages mean low productivity

source: Wikimedia Commons

[L]abor is most productive where its wages are largest. Poorly paid labor is inefficient labor, the world over…. The efficiency of labor always increases with the habitual wages of labor—for high wages mean increased self-respect, intelligence, hope, and energy.

–Henry George (Progress & Poverty, Book IX, Chapter 2)

George gives plenty of examples from his time, but modern examples abound too.  I happened on a 2006 article (pdf) by Wayne Cascio comparing how Sam’s Club and Costco treat their labor.  The short answer is: Costco treats their workers much better, including higher wages, better benefits, and more job security. And, the article continues, the results are consistent with Henry George. Based on 2005 data,

 Costco’s hourly labor rates are more than 40 percent higher than those at Sam’s Club ($17 versus $10.11), but when employee productivity is considered (sales per employee), Costco’s labor costs are lower than those at Sam’s Club (5.55 percent at Costco versus 6.25 percent at Sam’s Club).

Similar differences are cited in sales per square foot, and operating profit per employee.  Obviously, the figures nearly a decade later would be different, but I suspect the comparison would be similar.

Land value depends on the definition

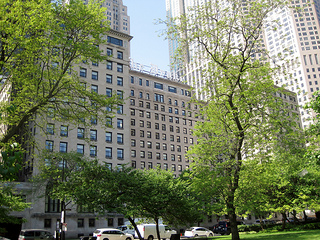
Image of Drake Hotel by Teemu008 (cc via flickr)

In an urban context, absent special environmental issues or legal constraints,  land value and location value are pretty much the same thing.  So we read in Crains that the Drake Hotel is on a 63,000 square foot parcel valued at $150 million, implying this land is worth about $2381/square foot.  But no, the location probably isn’t worth that much.  Rather, the land is leased by the owner of the structure, and the lease document says that, every five years, the land value is to be estimated and the annual rental set at 10% of the land value.

Possibly 10% was a reasonable return in the past, but in today’s zero-interest-rate world no safe investment would yield that much. Rather, the owner of the land actually owns two things: (1) the land, and (2) the privilege of requiring the building owner to pay an above-market rental rate.  Were we to value the land “as vacant,” which is the correct way to estimate land value for taxation purposes, then (2) would disappear and the land would be worth, more or less, the same per square foot as other land in the very prestigious immediate neighborhood.

It would be interesting to see what the lease says specifically about how the land value is to be estimated, and to read the (certainly confidential) document describing how the $150 million value is justified.

For more discussion about methods of valuing land for assessment purposes, duck around for works by Ted Gwartney on the subject, or consult the old but still-relevant TRED volume.

Location remains critical, even as the criteria change

image credit: xeni via flickr (cc)

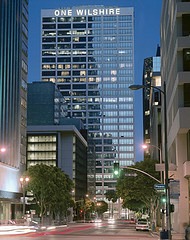
The Internet doesn’t make the earth economically flat.  Some locations are still worth many times as much as others.  But technology can affect the criteria for “most valuable site,” as most recently illustrated by the sale of One Wilshire Blvd in Los Angeles for more than twice the price per square foot of a mostly similar office building nearby. It also commands about twice the rent, per square foot.

The difference: One Wilshire is ” the primary terminus for major fiber-optic cable routes between Asia and North America,” and is therefore is a location prized by telecommunications firms.

“You can’t reproduce the connectivity,” said real estate broker Kevin Shannon of CBRE Group Inc. “It’s telecom gold.”

Of course the buyer thinks it’s a fine investment that will only become more valuable in the future.  Presumably the seller thinks different.  The only thing certain is that technology will change, and the pattern of valuable sites will likely be affected.

The taxing question of land value

1_69ffd9a3b25bee3673beaa1ee0190583UK Geoists are crowdsourcing a film about the nature and benefits resulting from a tax on the value of land.  You needn’t be a UK resident nor have a UK charge card in order to support this. Seeking a total of £9000, they’ve already got £2188 with 18 days to go.  Join the 46 funders so far, or find out more, here.

The other downside of export subsidies

Boeing and Airbus products photo by contri via flickr (cc)

Entrenched U S carrier Delta Airlines complains that their foreign competitors can buy Boeing jets cheaper than Delta can. Why? Because the federal Export-Import Bank offers loan guarantees, intended to make Boeing’s products more cost-competitive in the international marketplace, particularly against Airbus.

Of course this is a case where we might be better off allowing the “free market,” whatever that is, to set the cost of financing.  Abolish the ex-im bank, let manufacturers offer subsidized financing from their own resources if they wish, and don’t worry about the “balance” of trade.  But Boeing has sufficient political power that is unlikely.  Perhaps some favors will be offered to Delta, who doubtless also has political friends, in order to get them to drop the suit or minimize its practical impact.

As some indicator of the likely outcome, Influence Explorer says that Delta spent $4,154,382 on lobbying during the most recent reporting period, whereas Boeing spent $24,120,000.