Steve Keen did the great service of reading the FCIC report and confirming my impression (obtained without reading it) that it was not worth reading. And a few posts prior, he reported that Wendell Cox and friends are out with another edition of their annual Demographia report, showing, once again, that the ratio of house cost to income tends to be higher in metropolitan areas where housing development is relatively restricted, and lower where developers find it relatively easy to get clearance to build. (Their report is international in scope but I will limit my comments to their analysis of US conditions.)
They make the extremely valid point that differences in relative housing costs are mainly due, not to differences in construction costs, but to differences in land price. And of course, where development is restricted, the cost of developable land is likely to be high, resulting in higher cost of housing.
The facts are likely correct (their definition of “restricted” is based on their interpretation of a Brookings report that I’ve not read), but should one conclude that development restrictions ought to be eased in order that housing becomes more affordable? I think there are some other things to look at.
First, they are looking at the cost to purchase a detached house. In some areas, any respectable householder is expected to own and occupy such a unit, but in many of the high-cost areas it is perfectably acceptable to rent, or occupy a townhouse or apartment. Further, is it good public policy to encourage the purchase of real estate by people whose economic condition is fragile? Certainly, in the past 2 or 3 years in the US, they would have been better off to rent, which would have saved money, and banked the savings.
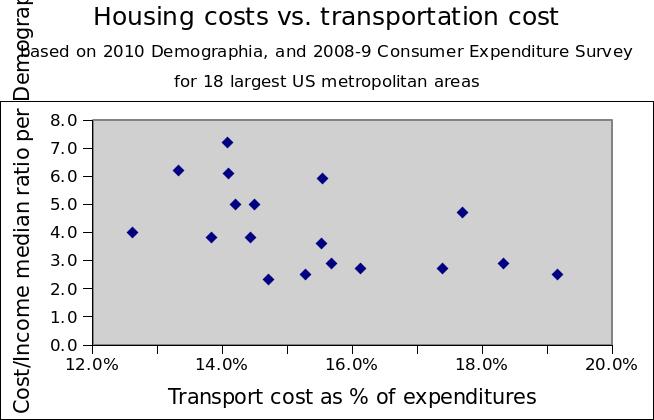
And expensive housing is usually accompanied by lower costs for other necessities. Such as transportation:
:

| Median | Transport | ||
| House | Cost as % | ||
| Price / | of total | ||
| Median | HH expen | ||
| Hhold | ditures | ||
| Income | |||
| Atlanta | 2.3 | 14.7% | |
| Baltimore | 4.0 | 12.6% | |
| Boston | 5.0 | 14.5% | |
| Chicago | 3.6 | 15.5% | |
| Cleveland | 2.5 | 15.3% | |
| Dallas- Fort Worth | 2.7 | 16.1% | |
| Detroit | 2.5 | 19.2% | |
| Houston | 2.9 | 18.3% | |
| Los Angeles | 5.9 | 15.5% | |
| Miami | 4.7 | 17.7% | |
| Minneapolis-St.Paul | 2.9 | 15.7% | |
| New York | 6.1 | 14.1% | |
| Philadelphia | 3.8 | 14.4% | |
| Phoenix | 2.7 | 17.4% | |
| San Diego | 6.2 | 13.3% | |
| San Francisco | 7.2 | 14.1% | |
| Seattle | 5.0 | 14.2% | |
| Washington, D.C. | 3.8 | 13.8% | |
(Expenditure data from http://bls.gov/cex/csxmsa.htm#y0809) The numbers might get even more interesting as fuel prices increase.
And just for fun, let’s pretend that land use restrictions really do improve the quality of life– whether that means more pedestrian-friendly communities or fewer flooded basements. If so, what would be the effect on land prices? Of course they would rise, and housing would become more expensive. The problem is that these communities generally fail to collect on that increased land value in order to reduce the burden of other taxes.