Taxing billboards– a win-win?

Since billboard value is a function of location in the community, it’s only fair that the community should collect most of the rental value.  Accordingly, the City of Toronto expects to collect C$10.4 million/year with a tax of $850/$24,000 per billboard, “depending on size and type.” Naturally, the billboarders object, saying that they’ll pass the tax on to landowners and advertisers (which somehow makes it illegal– but I do not understand U. S. law, let alone Canadian).  But of course, all taxes are ultimately paid by landowners. Perhaps the tax will reduce the number of billboards, but most citizens are likely to survive this loss.

Mayor Daley, being in a taxing mood, might want to consider this, if his obligations to the billboarders aren’t excessive. Chicago Reporter has found many illegal billboards in the city, and that politicians receive, not only free space, but cash contributions, from the billboarders.

ht Frank Dejong

Inequality vs. economic growth

Henry George notes that existence of privileged classes tends to reduce economic growth, because the rich must spend nonproductive effort stealing from the poor and protecting their gains, while the poor spend nonproductive effort trying to defend themselves.  And he noted that a large part of the labor force will comprise “idlers and those who minister to them.”

Something approximating the former category has recently been termed “guard labor” and some work has been done toward measuring it.  A comparison of U S states indicates that the proportion is higher where inequality is greater.  Cross-national comparison shows some correlation to polarization and political conflict.  A proposal is even made for something like a “citizens dividend,” tho the funding source isn’t identified.  Also, NYT column about costs of inequality here.

HT to Max Keiser (video).

Housing cost trends around the world

A great little interactive tool compares house price trends to income trends and general price levels for twenty countries. Be warned that it is flash-based.  Most series seem to go back to 1990.  Relative to incomes, Holland and Belgium show the greatest increases, while the big decliner was Japan.  Thanks to Steve Keen for finding it and providing the link, originally from The Economist. And of course we know that house prices mainly represent the cost of land (including the cost of permission to build).

Review of Lincoln’s new “LVT” book

LAND VALUE TAXATION: THEORY, EVIDENCE, AND PRACTICE
edited by Richard F. Dye and Richard W. England
Lincoln Institute of Land Policy, 2009

“[E]conomists agree on a great many things, but tend only to discuss the things about which they disagree,” writes Lincoln Institute (of Land Policy) chief Gregory K. Ingram in the Foreword to this new book.  And if one is disinclined to conspiracy theory, that might be the reason that the Single Tax and its various derivations don’t get much attention in the academic world.

A book about experience with the Single Tax would, of course, be a short one, since we don’t have any  experience of a modern economy in which the only tax is one that collects virtually all the land rent. Rather, this work examines some cases in which land has been taxed at a higher percentage of value than buildings and other improvements.

Continue reading Review of Lincoln’s new “LVT” book

The Secret Life of Real Estate

is subtitled “How it Moves and Why,” but this isn’t about the Kinetic Condos. It’s a response to a questions Georgists often hear: “If you’re so smart, why aren’t you rich?”  Different Georgists give different answers, including “I am rich.”

We know that the major cause of the business cycle is the capitalization and trading of government-protected privilege.  This privilege can be any kind of income obtained without producing, and may flow from spectrum licenses, drilling rights, patents, copyrights, or a hundred other sources.  But the main one is land ownership, since land is not a product of human labour.

When demand increases for a product or service, production can increase, but that isn’t true of privilege. The only limit on the price of privilege is what the market will bear without breaking.   So can’t we measure that price, use the information to forecast economic meltdowns, and thus become wealthy?

Our massive government statistics operations, which know how much more Asian-American households spend on rice than the rest of us do (4 times as much, as of 2003), and that people spend an average of 2.43 hours each weekday watching television, know just about nothing about the price of land.  Only a few countries maintain any such information (Korea, Japan, Denmark, and Australia come to mind).  Many local authorities compile land assessments, but the relationship to actual market prices is, at best, elastic, and the information is not systematically reported.  So indirect and ephemeral indicators must be relied upon.

Moreover, they land price cycle tends to run about 18 years, and may be disrupted by war (not by much else, it appears). This means that taking advantage of it requires a great deal of patience and, one can only say, a certain amount of faith.  And starting at a young enough age, by the way. Of course the cycle might be entirely abolished, but that would require the elites, and some of the non-elites, to surrender significant privilege.

The book is well-written, well-edited, and well-documented. (A subject index would be nice.) Economist Mason Gaffney’s  review is far more informed than anything I could have produced.  He points out a number of imperfections, but on the whole this is a very useful book for anybody who wants to know why many of us aren’t rich, or who would like to be.
Land Value vs. Land Rent

Altho Henry George’s proposal is “to abolish all taxation save that upon land values,” his objective really is to collect land rent for the community.  Of course land value is, ultimately, determined by anticipated land rent, but rent is more stable.

This is illustrated by a recent article in the Wall Street Journal (“Tax Break Divides Large, Small Builders,” Feb 11 ’09).   In an example cited as typical, Pulte Homes is reported to have sold, for $2 million, land they had “originally paid $28 million for.”  So if land value declined by over 92%, how much did land rent decline?

Probably quite a bit less than 92%, because the $28 million was based on Pulte’s guess as to what the future land rent would be.  The actual rent, the amount that someone would have paid to use the land at the time Pulte bought it,  was doubtless much less than their expectation of its future amount.

Some opponents of land value taxation cite cases of great declines in land prices to claim that LVT wouldn’t be a stable source of revenue.  But LVT moderates speculation, and land prices would be more stable if more of the land rent was collected for public use.

One illustration of this is that states where real estate tax is relatively high have experienced more stable prices for homes and lots.

Another Chicago classic now available

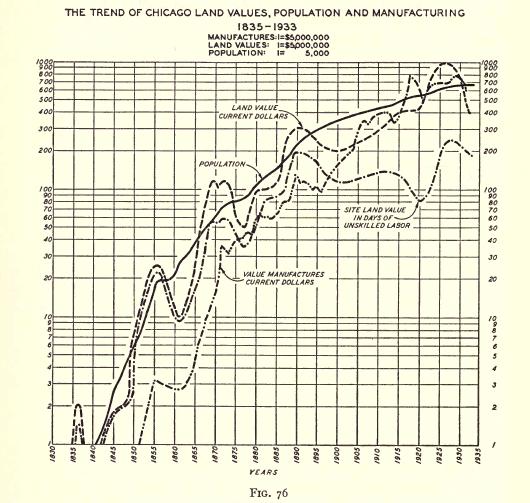
Homer Hoyt’s 1933 book “100 Years of Land value in Chicago” is now posted at the Internet Archive. Only a few land value nerds will read it all the way thru, but all should be impressed by the quantity of work Hoyt put into it, describing and analyzing Chicago’s land market for its first century.

Summary graph of land values

This was all done before cheap photocopiers, faxes, and of course computers. I wish someone would update it.

Olcott's Land Values Blue Book

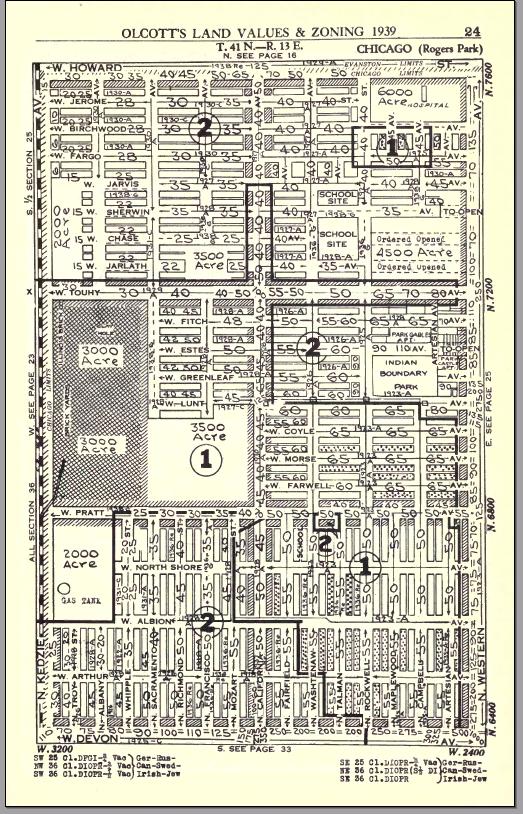
One of the challenges for many beginning Henry George School students is to understand that land has value, and that the value of land is really not very difficult to determine.  One example that we used to use was Olcott’s Land Values Blue Book, an annual publication that, until the early ’90s, reported the estimated land value for every block in Chicago and much of suburban Cook County.  I don’t know exactly why the series was discontinued, but I assume it was because professionals now find the Internet a more convenient source of information.

The 1939 edition of Olcott’s has been scanned and posted to the Internet Archive.  Below is an example page.

Sample page from Olcott's

The numbers in most areas are value per front foot for a standard-sized lot.  The book includes adjustment factors for use where lots are other than standard.  For unsubdivided parcels, a value per acre is shown.

Strange pricing in the book business

This post isn’t about how the field of economics was corrupted, but rather about the strange pricing of the eponymous book by Mason Gaffney and Fred Harrison. I’ll use it in a course next term, so I wanted to get some copies because Henry George School policy is to include the book in the registration fee.

Schalkenbach, the U S distributor,  is charging $16 plus shipping. They’ll probably give us only a small discount, so since the book is 14 years old I decided to check other sources including used copies.

According to bookfinder4u, abebooks,  froogle and amazon, nobody is selling this for less than $21.88 plus shipping.  Amazon says that a used copy costs $35.64 while a new one can be had for $22.95. No sign of it on ebay at all. Of course this can all change very quickly, but it’s curious to see it at all.

I suspect that no one at Schalkenbach reads this blog, at least not right away, so I shall hasten to order a few copies from them.